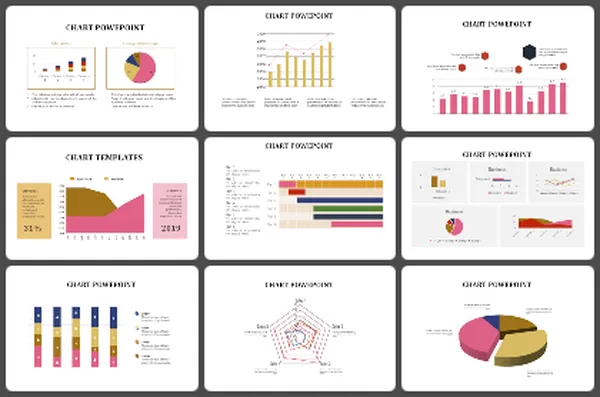
Business Chart PowerPoint Templates & Google Slides Themes

Slide with various chart types in blue, including bar, horizontal bar, line, pie, and area charts, in a business context.
P.ID : 32118
    331 views
    32 Downloads
    Get Custom Slides by Experts
    Instantly Access Templates in PowerPoint

    Chart Presentation Template


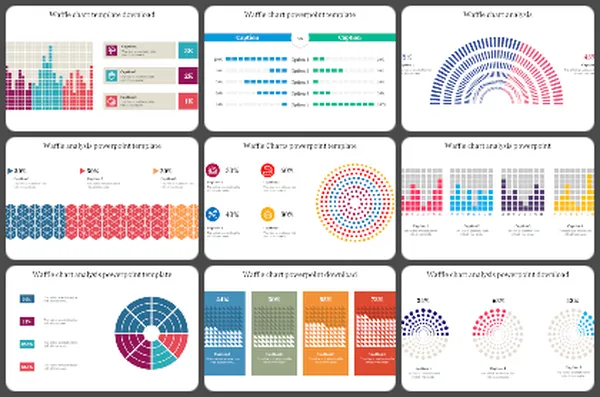
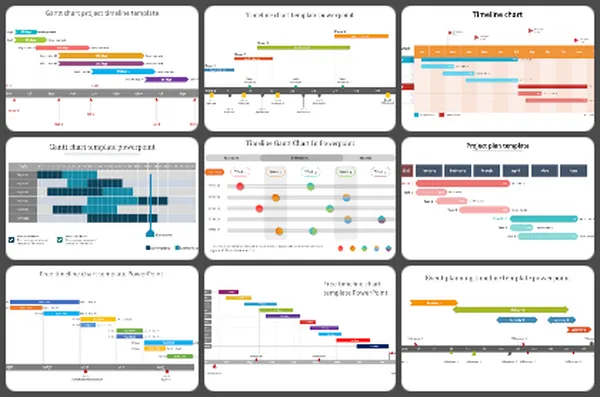
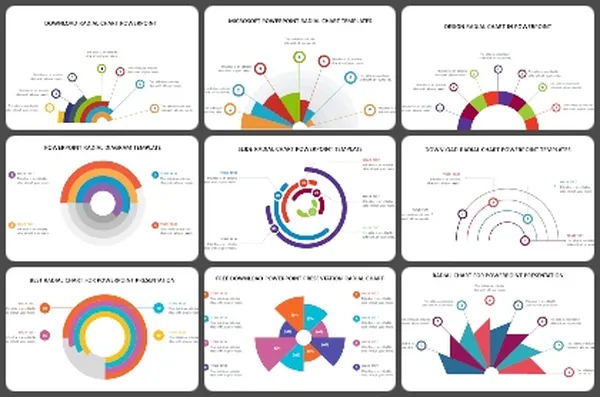
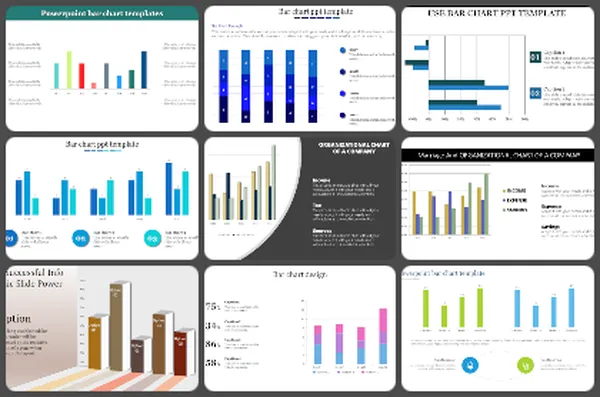
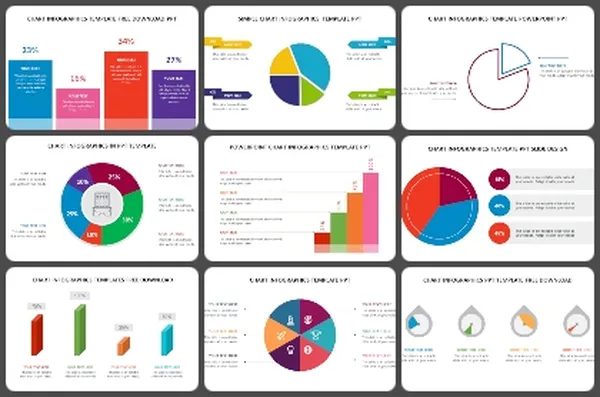
    Your data speaks volumes with our Chart Presentation Templates, now compatible with Google Slides. These templates offer a visual platform to enrich your message and captivate your audience. Featuring pre-designed charts and graphs, they simplify the presentation of complex information. Select from a range of layouts and designs, all set against a clean white background to More...
    Advertisement

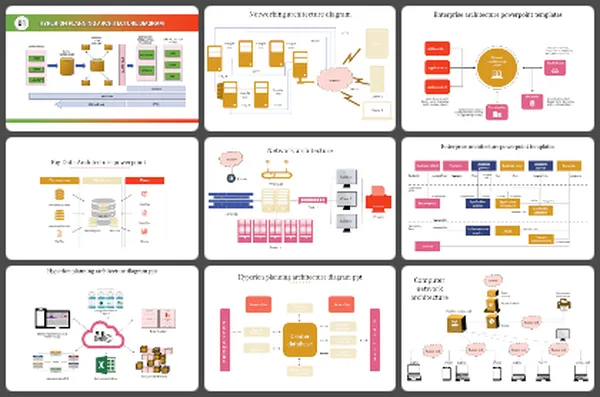
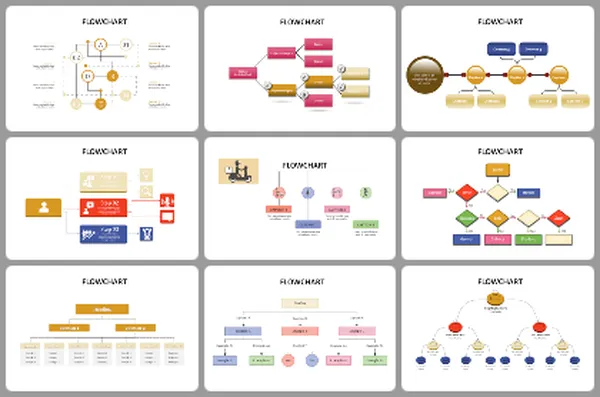
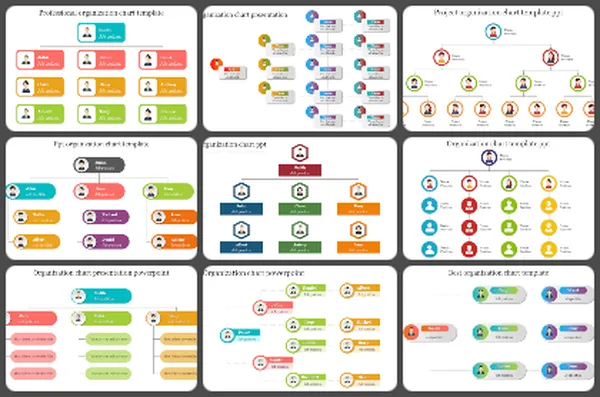
    You May Also Like These PowerPoint Templates

    Add to Wishlist
    Download
    AI Customize
    3D triangular bar chart in yellow, orange, and blue shades showing monthly data for four categories, on a dark background.
    Add to Wishlist
    Download
    AI Customize
    Bar chart slide with colorful conical graphs representing different categories, accompanied by labeled captions and icons.
    Add to Wishlist
    Download
    AI Customize
    Slide displaying two pie charts with quarter wise performance data, along with performance percentages at the bottom.
    Add to Wishlist
    Download
    AI Customize
    PowerPoint slide showcasing a chart with project status trends and a progress bar for each year.
    Add to Wishlist
    Download
    AI Customize
    Four panel chart slide featuring a line, bar, and pie chart, each displaying data trends and comparisons.
    Free
    Add to Wishlist
    Download
    AI Customize
    A simple chart slide with overlaid blue, green, orange, and yellow circles of varying sizes with a graph and captions.
    Add to Wishlist
    Download
    AI Customize
    3D cone chart with orange, pink, and blue segments, placed on a gray platform with a white background.
    Add to Wishlist
    Download
    AI Customize
    Slide featuring a businessman pointing at a board with a pie chart and two circular progress visuals in red and yellow.
    Add to Wishlist
    Download
    AI Customize
    Slide featuring three green pie charts and a line graph below, illustrating data trends for different categories.
    Free
    Add to Wishlist
    Download
    AI Customize
    Bar graph showing revenue and sales data for 3D Ocean, Web, Graphics, Video, and Design in a business plan presentation.
    Add to Wishlist
    Download
    AI Customize
    Gantt chart PowerPoint template showing a timeline for multiple targets across January, February, and March, with milestones.
    Add to Wishlist
    Download
    AI Customize
    Bar chart slide showing the performance of four products with categories like sales growth, market share, and profit margin.
    Add to Wishlist
    Download
    AI Customize
    Colorful timeline PowerPoint chart illustrating shifts for various employees throughout the day with peak hours highlighted.
    Free
    Add to Wishlist
    Download
    AI Customize
    Green bar graph depicting growth over six months, with two gear icons and captions on the left.
    Add to Wishlist
    Download
    AI Customize
    Bar chart slide showcasing yearly data from 2016 to 2021, with three distinct bar categories and values in shades of purple.
    Add to Wishlist
    Download
    AI Customize
    Dashboard layout showing net worth value, asset categories in a pie chart, and bar chart for real estate comparisons.
    Free
    Add to Wishlist
    Download
    AI Customize
    Business plan infographic with a four-quadrant layout labeled with sales strategies and a 3D pie chart on the right.
    Add to Wishlist
    Download
    AI Customize
    Slide featuring a 3D bar graph with three series on dark backdrop, a green star shaped badge, and text boxes below.