Stunning Chart Presentation Template Slide Designs

 Canva
Canva
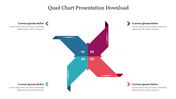
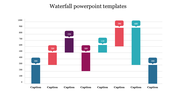
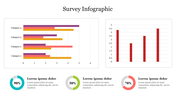
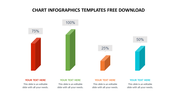
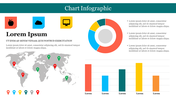
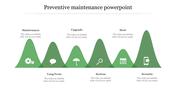
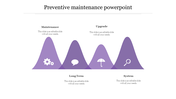
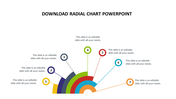

Chart PowerPoint Template and Google Slides Themes
Release the power of data with our dynamic Chart PowerPoint Template and Google Slides Themes. With four nodes dedicated to marketing development, each boasting engaging captions, title holders, and spacious text areas, this template redefines presentation excellence.
Ideal for strategists, analysts, and professionals seeking to captivate audiences, this blend of visual allure and functionality is a game-changer. Bid farewell to mundane slides as our template breathes life into your content, offering fresh perspectives on data visualization.
Crafted for marketers, consultants, and educators, it ensures your message shines through with impact. Stand out, engage, and deliver with confidence using our Chart PowerPoint Template and Google Slides Themes.
Features of the Template
- 100 % customizable slides.
- The slide show is in 4:3, 16:9, zip format.
- There is powerful connectivity with Google Slides and PowerPoint.
- It is simple and quick to alter the slide's color.
- An efficient template that can be easily accessed immediately.
- Well-crafted template with an instant download facility.


You May Also Like These PowerPoint Templates
Add to Wishlist
Download
AI Customize


Add to Wishlist
Download
AI Customize

Add to Wishlist
Download
AI Customize


Add to Wishlist
Download
AI Customize


Add to Wishlist
Download
AI Customize

Add to Wishlist
Download
AI Customize

Add to Wishlist
Download
AI Customize

Add to Wishlist
Download
AI Customize

Add to Wishlist
Download
AI Customize


Add to Wishlist
Download
AI Customize

Add to Wishlist
Download
AI Customize


Add to Wishlist
Download
AI Customize

Add to Wishlist
Download
AI Customize

Add to Wishlist
Download
AI Customize

Add to Wishlist
Download
AI Customize
