We have the Best Collection of Chart Presentation Template

We have the Best Collection of Chart Presentation Template
P.ID : 32014
    218 views
    11 Downloads
    Get Custom Slides by Experts
    Instantly Access Templates in PowerPoint

    Dynamic Chart Presentation Templates: Improve Data Visualization"


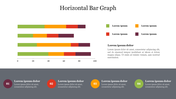
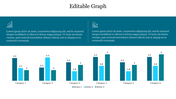
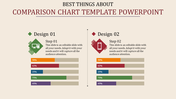
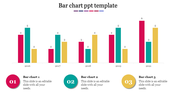
    Craft compelling presentations with our Chart Presentation PowerPoint Templates and Google Slides Themes. Each template features dual nodes, intuitive captioning, robust title holders, and expansive text areas. Perfect for analysts, marketers, and educators, these slides empower you to showcase data trends and insights vividly.

    Unlike outdated options, our templates leverage contemporary design principles to enhance visual appeal and user engagement. Seamlessly integrate charts and graphs to convey complex information effortlessly. Whether preparing quarterly reports or educational lectures, our templates streamline your workflow, ensuring clarity and professionalism in every presentation.

    Download now and transform your data into impactful stories with our user-friendly templates. Ideal for professionals seeking to excel in data visualization and presentation excellence.

    Features of the Template


    • 100 % customisable slides.
    • The slide show is in 4:3, 16:9, zip format.
    • There is powerful connectivity with Google Slides and PowerPoint.
    • It is simple and quick to alter the slide's colour.
    • An efficient template that can be easily accessed immediately.
    • Well-crafted template with an instant download facility.
    Advertisement

    You May Also Like These PowerPoint Templates

    Free
    Add to Wishlist
    Download
    AI Customize
    Colorful bar chart with three data categories and corresponding bars each with caption areas.
    Add to Wishlist
    Download
    AI Customize
    Colorful bar graph illustrating monthly data with values for each month from january to december.
    Add to Wishlist
    Download
    AI Customize
    Slide with a businessman holding a megaphone projecting speech bubble displaying communication icons, and bar charts below.
    Add to Wishlist
    Download
    AI Customize
    Illustration of a chart with yellow, red, and green horizontal bars displaying percentages and paper boat icons on waves.
    Add to Wishlist
    Download
    AI Customize
    Creative graph slide with colorful numbered captions and a bar chart displaying varying percentage values from 40% to 80%.
    Free
    Add to Wishlist
    Download
    AI Customize
    Three separate bar charts in red tones, each section labeled with a percentage and caption.
    Add to Wishlist
    Download
    AI Customize
    A slide featuring four bar graphs labeled A, B, C, and D with caption areas underneath, connected by dotted arrows.
    Add to Wishlist
    Download
    AI Customize
    Colorful progress bars in rows, showing numbered squares in red, teal, purple, and blue, with text on the right.
    Add to Wishlist
    Download
    AI Customize
    Chart showing blue bars representing growth metric alongside an orange line marking an ascending trend over eight categories.
    Add to Wishlist
    Download
    AI Customize
    Horizontal bar graph slide with four colored steps and corresponding descriptions on the right.
    Add to Wishlist
    Download
    AI Customize
    Three charts with orange bars displayed against dark backgrounds, each labeled with categories and series.
    Add to Wishlist
    Download
    AI Customize
    Progress bar template showing Process A and B side by side, with four stages and completion percentages.
    Add to Wishlist
    Download
    AI Customize
    Presentation slide featuring multicolored bar graphs for categories and a purple and gray pie chart with text sections below.
    Add to Wishlist
    Download
    AI Customize
    Vertical bar chart in red shades, displaying yearly data from 2017 to 2020, with detailed labels on the right.
    Add to Wishlist
    Download
    AI Customize
    Stacked traction bar graph with red, blue, green, orange bars labeled with percentage values and caption areas.
    Add to Wishlist
    Download
    AI Customize
    Green shaded bar chart displaying data from 2016 to 2021, with three numbered captions below.
    Add to Wishlist
    Download
    AI Customize
    Chart slide showing market supply data from 2004 to 2014 with red bars and percentage annotations.
    Add to Wishlist
    Download
    AI Customize
    Bar chart with two sections in orange and green, with captions and numerical values under each.