Best Chart PowerPoint Presentation Template Design

Bar chart slide template with a blue background, illustrating development data with search options beside the graph.
P.ID : 34046
    58 views
    3 Downloads
    Get Custom Slides by Experts
    Instantly Access Templates in PowerPoint

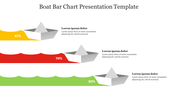
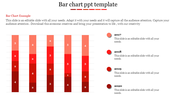
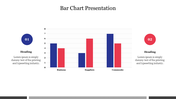
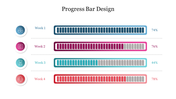
    Chart Presentation Template


    Create an Engaging presentation with our Chart PowerPoint Template.

    The Slide: A Visual Symphony

    Our Chart Presentation template features a captivating slide that effortlessly communicates your insights. 

    Development Sections:
    On either side of the central bar chart, you’ll find two elegant text areas labeled “Development.” These rounded rectangles beckon attention, framing your content beautifully. The placeholder text within these sections invites customization. Replace it with your key points, project updates, or growth metrics.

    The Bar Chart:
    At the heart of the slide lies the star attraction: a bar chart that speaks volumes. Crisp blue bars ascend against a subtle grid background, making data visualization intuitive. Each bar represents a value, whether it’s sales figures, survey results, or performance metrics. Your audience will grasp the trends at a glance.

    Who Can Benefit?

    Professionals: Whether you’re pitching to clients, presenting at a board meeting, or sharing insights with colleagues, these templates streamline your message.

    When your message resonates, success follows. Download our chart PPT templates now!


    Features of the template:

    •  Slides are available in 4:3 & 16:9
    • Well-crafted template with instant download.
    • Get slides that are 100% customizable and easy to download
    Advertisement

    You May Also Like These PowerPoint Templates

    Add to Wishlist
    Download
    AI Customize
    Horizontal bar graph slide with four color coded categories in green, yellow, red, and purple, with text descriptions.
    Add to Wishlist
    Download
    AI Customize
    A slide with a comparison chart featuring two designs, each with steps and bar graphs in orange, red, blue, green and purple.
    Free
    Add to Wishlist
    Download
    AI Customize
    Top Notch Comparison Bar Graph PowerPoint Presentation
    Add to Wishlist
    Download
    AI Customize
    A slide displaying a sample bar chart with monthly data from may to december, featuring colorful bars and descriptive text.
    Add to Wishlist
    Download
    AI Customize
    Horizontal chart with four colored bars, each with a color coded icon and caption on the left.
    Add to Wishlist
    Download
    AI Customize
    Bar chart in four distinct bars in multi colour each showing data points with corresponding labels, values and caption areas.
    Add to Wishlist
    Download
    AI Customize
    Chart PowerPoint slide with bar graph and four icons representing data, calendar, and people with placeholder text.
    Add to Wishlist
    Download
    AI Customize
    Colorful bar graph illustrating monthly data with values for each month from january to december.
    Add to Wishlist
    Download
    AI Customize
    Slide with a businessman holding a megaphone projecting speech bubble displaying communication icons, and bar charts below.
    Add to Wishlist
    Download
    AI Customize
    Creative graph slide with colorful numbered captions and a bar chart displaying varying percentage values from 40% to 80%.
    Free
    Add to Wishlist
    Download
    AI Customize
    Three separate bar charts in red tones, each section labeled with a percentage and caption.
    Add to Wishlist
    Download
    AI Customize
    A slide featuring four bar graphs labeled A, B, C, and D with caption areas underneath, connected by dotted arrows.
    Add to Wishlist
    Download
    AI Customize
    Three charts with orange bars displayed against dark backgrounds, each labeled with categories and series.
    Add to Wishlist
    Download
    AI Customize
    Progress bar template showing Process A and B side by side, with four stages and completion percentages.
    Add to Wishlist
    Download
    AI Customize
    Presentation slide featuring multicolored bar graphs for categories and a purple and gray pie chart with text sections below.
    Add to Wishlist
    Download
    AI Customize
    Bar chart with two sections in orange and green, with captions and numerical values under each.