Attractive Chart Presentation Slide Template Designs

Bar chart presentation in PowerPoint, with data for the years 2017 to 2020 and accompanying captions.
P.ID : 33938
    94 views
    5 Downloads
    Get Custom Slides by Experts
    Instantly Access Templates in PowerPoint

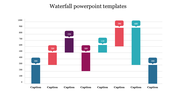
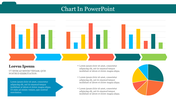
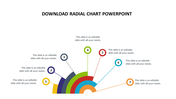
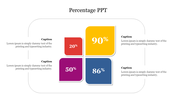
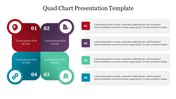
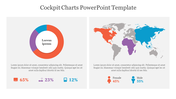
    Chart Presentation Templates and Google Slides


    When it comes to delivering impactful presentations, the art of chart presentation holds unparalleled significance. Imagine your data taking shape not just as numbers, but as a visual story that captivates and informs. A key player in this narrative is the bar chart, a stalwart in data visualization known for its clarity and directness. Whether you're showcasing market trends, financial forecasts, or project milestones, a well-crafted bar chart presentation template can elevate your message to new heights.

    In the realm of business, where every presentation can make or break a deal, utilizing a bar chart presentation template isn't just about graphs—it's about clarity, professionalism, and persuasion. It's about transforming raw data into a visual language that speaks volumes, reinforcing your expertise and enhancing your credibility. Next time you prepare to engage stakeholders or clients, consider the power of a well-designed bar chart to not only convey information but to leave a lasting impression.

    Features of the Template:

    • 100% customizable slides and easy to download.
    • Slides are available in different nodes & colors.
    • The slide contains 16:9 and 4:3 formats.
    • Easy to change the colors of the slide quickly.
    • Well-crafted template with an instant download facility.
    Advertisement

    You May Also Like These PowerPoint Templates

    Add to Wishlist
    Download
    AI Customize
    Radial chart with four concentric arcs labeled 30%, 40%, 70%, and 100%, connected to icons and caption areas.
    Free
    Add to Wishlist
    Download
    AI Customize
    Orange and black cylindrical bars in a 3D chart design placed on a gray base with descriptive captions.
    Add to Wishlist
    Download
    AI Customize
    Slide illustrating a goal chart with an arrow pointing at a target and four colored bars showing percentage milestones.
    Free
    Add to Wishlist
    Download
    AI Customize
    Four colorful 3D bars in varying heights and percentages, alongside icons and descriptions on a beige background.
    Add to Wishlist
    Download
    AI Customize
    Colorful 3D bar chart with pink, red, blue, and yellow bars, each labeled with percentages.
    Free
    Add to Wishlist
    Download
    AI Customize
    Infographic PowerPoint slide with three bar charts showing weekly data with percentages for each day of the week.
    Add to Wishlist
    Download
    AI Customize
    Donut chart with alternating blue and black segments, labeled with percentages, and four icon based text boxes on the right.
    Add to Wishlist
    Download
    AI Customize
    Four 3D cone charts in red, blue, teal, and green with icons at the top, and labeled for different metrics.
    Add to Wishlist
    Download
    AI Customize
    PowerPoint slide featuring a circular chart infographic with sections for text.
    Add to Wishlist
    Download
    AI Customize
    Chart with four colored bars, each featuring an icon on the left and space for text, arranged in a vertical sequence.
    Add to Wishlist
    Download
    AI Customize
    Stunning Chart Infographics Template Free Download PPT
    Free
    Add to Wishlist
    Download
    AI Customize
    PowerPoint infographic with four colored pill shaped sections each labeled with placeholder text.
    Add to Wishlist
    Download
    AI Customize
    Chart infographic template with three progress bars in blue, red, and green accompanied by icons.
    Add to Wishlist
    Download
    AI Customize
    Chart infographic template with different chart types, including pie charts, bar charts, and a donut chart.
    Free
    Add to Wishlist
    Download
    AI Customize
    Infographic chart with four colorful blocks, each displaying a percentage, connected by a gray upward arrow.
    Add to Wishlist
    Download
    AI Customize
    Bubble Scatter PowerPoint Template With Three Nodes
    Add to Wishlist
    Download
    AI Customize
    Infographic slide with two colorful line charts from 2016 to 2019, on a blurred background of a tablet displaying data.
    Add to Wishlist
    Download
    AI Customize
    Download Unlimited Chart Template Presentation