Free - 100% Editable Chart Presentation PowerPoint And Google Slides
Free

 Canva
Canva
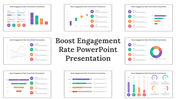
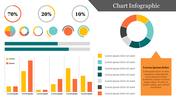

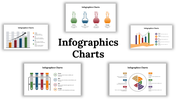
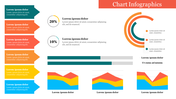

Free Chart Presentation PowerPoint Templates
Ditch the boring charts and make your data shine! Our FREE chart presentation PowerPoint templates and Google Slides themes (yes, completely free!) turn your numbers into easy-to-understand pictures. This free template includes a bunch of colorful and simple charts you can fill in to make your presentations clear and eye-catching. No matter if you're a salesperson showing off results, a teacher explaining something in class, or anyone who wants to present data in a cool way, this template lets you ditch the text overload and grab everyone's attention. Unlike confusing chart templates, ours keeps it simple with a variety of colorful and easy-to-use charts. Download this FREE chart presentation template today and turn your data into a presentation that wows your audience
Features of the template
- 100% customizable slides and easy to download.
- The slides contain 16:9 and 4:3 formats.
- Easy to change the colors quickly.
- It is a well-crafted template with an instant download facility.
- It is a 100% pre-designed slide.
- The slide holds vibrant colors.


You May Also Like These PowerPoint Templates

Add to Wishlist
Download
AI Customize


Add to Wishlist
Download
AI Customize


Add to Wishlist
Download
AI Customize

Add to Wishlist
Download
AI Customize


Add to Wishlist
Download
AI Customize

Add to Wishlist
Download
AI Customize

Add to Wishlist
Download
AI Customize

Add to Wishlist
Download
AI Customize

Add to Wishlist
Download
AI Customize

Add to Wishlist
Download
AI Customize

Add to Wishlist
Download
AI Customize

Add to Wishlist
Download
AI Customize

Add to Wishlist
Download
AI Customize

Add to Wishlist
Download
AI Customize

Add to Wishlist
Download
AI Customize

Add to Wishlist
Download
AI Customize
