Best Collection of Chart Presentation Slides

Area chart with overlapping blue, teal, and green sections, timeline on the axis, and three labeled boxes below.
P.ID : 25718
    128 views
    3 Downloads
    Get Custom Slides by Experts
    Instantly Access Templates in PowerPoint

    Area Chart Presentation Template


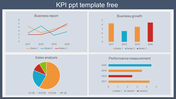
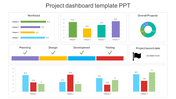
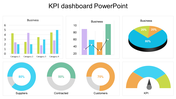
    Charts are essential tools for illustrating data trends, making information easily digestible and visually appealing. Our Chart Presentation Template and Google Slides Themes are designed to help you achieve this. Featuring a blue-themed chart with data visualization and three caption text areas, this template is ideal for presenting statistics, financial data, and performance metrics. Its clean and professional design ensures your audience can quickly grasp the key points of your presentation.

    Perfect for business meetings, academic lectures, and project reports, this template helps you convey complex data clearly and engagingly. Enhance your presentations with our Chart Presentation Template and Google Slides Themes, and make your data stand out with clarity and precision.

    Features of this template

    • 100 % customizable slides are easy to download. 
    • Slides are available in different nodes and colors.
    • The slide was contained in 16:9 and 4:3 formats.
    • It is easy to change the slide colors quickly.
    • Well-crafted template with an instant download facility.
    Advertisement

    You May Also Like These PowerPoint Templates

    Free
    Add to Wishlist
    Download
    AI Customize
    Four vertical bar charts in orange, blue, red, and green on a white background, each with captions below.
    Add to Wishlist
    Download
    AI Customize
    Colorful pie chart with four segments in blue, purple, red, and orange, with matching text boxes showing percentages.
    Add to Wishlist
    Download
    AI Customize
    Metrics Dashboard PowerPoint Template & Google Slides
    Add to Wishlist
    Download
    AI Customize
    Editable Cockpit Charts PowerPoint Slide Template Design
    Add to Wishlist
    Download
    AI Customize
    Blank chart slide with a weekly layout from monday to sunday, featuring a grid for scheduling or organizing tasks.
    Free
    Add to Wishlist
    Download
    AI Customize
    Cute PowerPoint Radar Chart Templates For Presentation
    Add to Wishlist
    Download
    AI Customize
    Hoshin Kanri slide with a blue grid design labeled sections for annual objectives and a compass icon at the bottom.
    Add to Wishlist
    Download
    AI Customize
    Bar graph on a slide showing data from 2016 to 2019, with a title about statistics and a caption area section.
    Add to Wishlist
    Download
    AI Customize
    Stacked Bar Chart PowerPoint Template Presentation
    Add to Wishlist
    Download
    AI Customize
    Editable Dot Charts PowerPoint Template For Presentation
    Add to Wishlist
    Download
    AI Customize
    Slide showcasing survey data with percentage figures in colored text boxes and icons with a comparative bar chart.
    Add to Wishlist
    Download
    AI Customize
    Hexagonal web chart with blue and red lines showing financial data for six business areas at the corners.
    Free
    Add to Wishlist
    Download
    AI Customize
    KPI Dashboard Template PPT & Google Slides Presentation
    Add to Wishlist
    Download
    AI Customize
    Best Change Curve PowerPoint Template Readily For You
    Add to Wishlist
    Download
    AI Customize
    Innovative Cockpit Charts PowerPoint Download PPT Slides
    Add to Wishlist
    Download
    AI Customize
    A line chart  slide showing data trends across seven items with two percentage indicators with icons and caption areas.
    Add to Wishlist
    Download
    AI Customize
    Bar chart slide showing data trends from 2016 to 2021 with three categories, highlighted in red, teal, and yellow bars.