Chart PowerPoint Template and Google Slides

 Canva
Canva


Chart PowerPoint Template and Google Slides
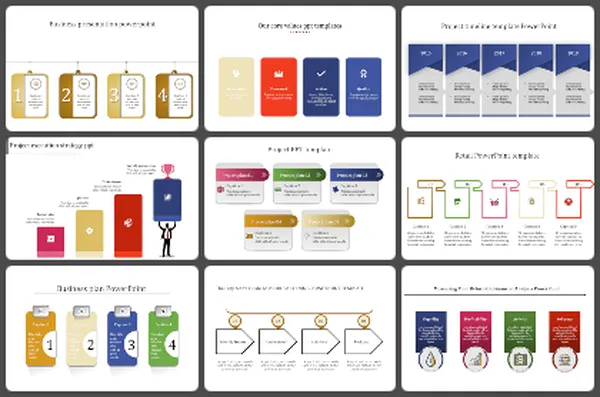
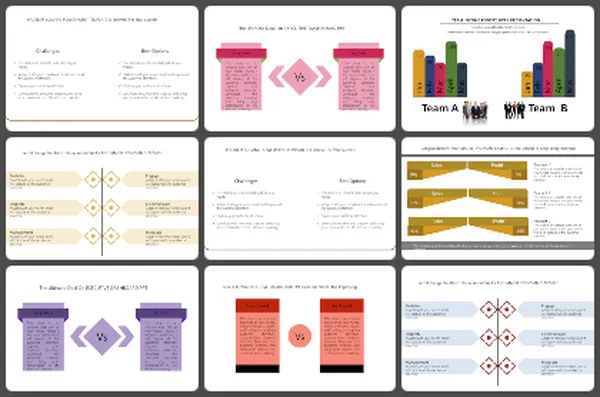
The "Chart PowerPoint Template and Google Slides" features a visually appealing chart presentation with four 3D bars representing different categories: business, target, growth, and profit. Each bar is labeled and accompanied by its corresponding percentage, presented in vibrant colors, and complemented by icons, enhancing the visual appeal and clarity of the chart.
This More...
You May Also Like These PowerPoint Templates
Add to Wishlist
Download
AI Customize

Add to Wishlist
Download
AI Customize

Add to Wishlist
Download
AI Customize

Add to Wishlist
Download
AI Customize


Add to Wishlist
Download
AI Customize

Free
Add to Wishlist
Download
AI Customize


Add to Wishlist
Download
AI Customize

Add to Wishlist
Download
AI Customize

Add to Wishlist
Download
AI Customize


Add to Wishlist
Download
AI Customize

Add to Wishlist
Download
AI Customize

Add to Wishlist
Download
AI Customize


Add to Wishlist
Download
AI Customize

Add to Wishlist
Download
AI Customize

Add to Wishlist
Download
AI Customize

Add to Wishlist
Download
AI Customize
