Free - Get Chart Infographics PPT Template Free Download

Free
Chart infographic with four drop shaped gauge style meters in blue, green, yellow, and red, each with text below.
P.ID : 49714
    163 views
    46 Downloads
    Get Custom Slides by Experts
    Instantly Access Templates in PowerPoint

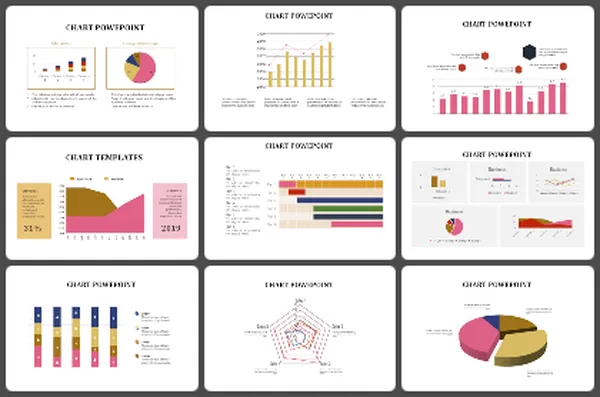
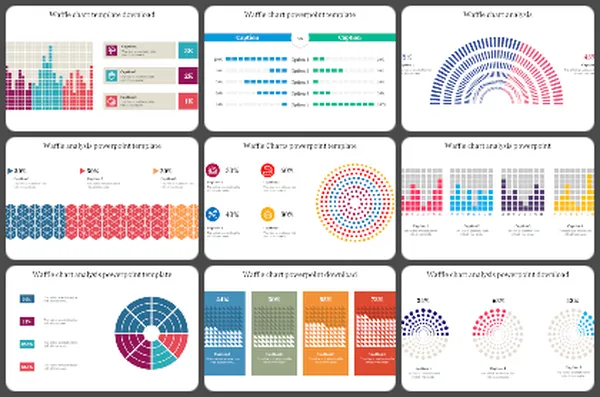
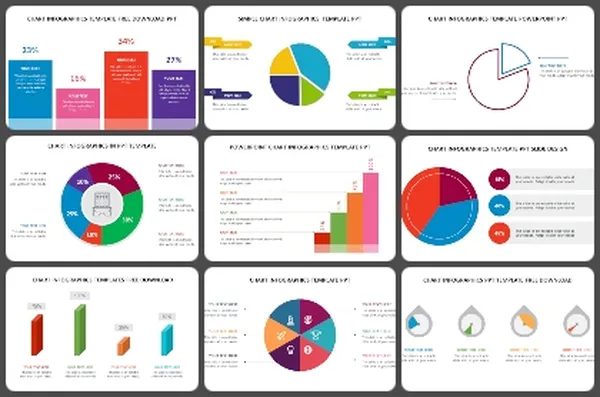
    Practical Chart Infographics PowerPoint Template With Four Pinpoints

    Do you wonder what the purpose of charts in PowerPoint is? Charts help to show the data more effectively and understandable than the raw data. Download our Chart Infographics Template to present your business status or activities in four steps to an audience. If you want to explain your business process, More...
    Advertisement

    You May Also Like These PowerPoint Templates

    Add to Wishlist
    Download
    AI Customize
    Slide showcasing survey data with percentage figures in colored text boxes and icons with a comparative bar chart.
    Add to Wishlist
    Download
    AI Customize
    Change curve diagram mapping emotional responses over time, with stages from shock and denial along a wavy line.
    Add to Wishlist
    Download
    AI Customize
    Bar chart slide showing data trends from 2016 to 2021 with three categories, highlighted in red, teal, and yellow bars.
    Free
    Add to Wishlist
    Download
    AI Customize
    Color-coded Gantt chart template for project management, displaying four phases across quarters with colorful text boxes.
    Add to Wishlist
    Download
    AI Customize
    KPI dashboard template with six sections which includes charts, graphs, and numerical data.
    Add to Wishlist
    Download
    AI Customize
    Hexagonal web chart with blue and red lines showing financial data for six business areas at the corners.
    Add to Wishlist
    Download
    AI Customize
    Innovative Cockpit Charts PowerPoint Download PPT Slides
    Add to Wishlist
    Download
    AI Customize
    Three outlined boxes in yellow, red, and green, each with circles labeled K, W, and L, at the bottom.
    Add to Wishlist
    Download
    AI Customize
    KPI Infographics PowerPoint And Google Slides Themes
    Free
    Add to Wishlist
    Download
    AI Customize
    Real estate KPI dashboard showing quarterly data in a green colored pie chart and bar graphs across various categories.
    Add to Wishlist
    Download
    AI Customize
    A line chart  slide showing data trends across seven items with two percentage indicators with icons and caption areas.
    Add to Wishlist
    Download
    AI Customize
    Pricing Strategy chart slide highlighting four key areas from price to promotion with icons in a diamond layout.
    Add to Wishlist
    Download
    AI Customize
    A project management dashboard slide featuring a table of test case data alongside visual graphs and planned progress.
    Add to Wishlist
    Download
    AI Customize
    Color coded timeline chart slide showing tasks over 10 months, from june 2019 to february 2020, with labeled milestones.
    Add to Wishlist
    Download
    AI Customize
    Circular progress bar with four colorful concentric rings and percentage labels, surrounded by text areas.
    Add to Wishlist
    Download
    AI Customize
    Timeline chart slide depicting four colored project phases with major milestones and key dates.
    Add to Wishlist
    Download
    AI Customize
    A dynamic slide layout featuring a circular pie chart, with labeled segments and placeholder text.