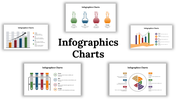
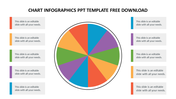
Amazing Editable Chart Infographics In PPT Template Slide

Slide with a circular pie chart showing data distribution in red, green, orange,  blue, and purple, with text around it.
P.ID : 49710
    354 views
    46 Downloads
    Get Custom Slides by Experts
    Instantly Access Templates in PowerPoint

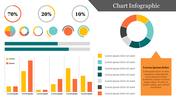
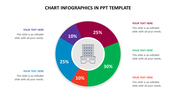
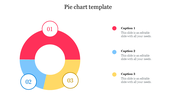
    Attractive Pie Chart Infographics Diagram Template 

    Charts help you visually portray business data as a fraction of a whole. Get our Free Chart Infographics Templates to present your different business activities and compare their status. If you want to explain your business function in a 3d pie chart, use our PowerPoint. The PowerPoint is mainly used in progress and company strategy meetings. You can use this PPT to track multiple business data classes. It is a pre-built PowerPoint with a circle design to save time. This template contains a circle split into five parts with different shades and text areas. You can add or modify the font size, logo, theme, and text. In addition, Users can select any Method PPT template for their needs.

    Features of this template

    • 100% Customizable (shape color, size & text)
    • This template has a pie chart theme.
    • Huge Collections of process slides to impress your audience
    • It further supports the 16:9 and 4:3 format
    • Easily readable and acceptable template.
    Advertisement

    You May Also Like These PowerPoint Templates

    Add to Wishlist
    Download
    AI Customize
    Our Predesigned PowerPoint Template Design-Three Node
    Free
    Add to Wishlist
    Download
    AI Customize
    Free Chart Infographics in PPT Template & Google Slides
    Add to Wishlist
    Download
    AI Customize
    Best Circular Flow Chart PPT Template and Google Slides
    Add to Wishlist
    Download
    AI Customize
    Best Milestone Chart PowerPoint Presentation Template
    Free
    Add to Wishlist
    Download
    AI Customize
    3D pie chart slide showing five colored segments with percentages each labeled with placeholder text.
    Add to Wishlist
    Download
    AI Customize
    A slide showing four colorful triangles labeled with percentages representing effect, planning, execution, and hard work.
    Free
    Add to Wishlist
    Download
    AI Customize
    3D pie chart template with colorful segments and text placeholders, with a personal figure pointing at the chart.
    Add to Wishlist
    Download
    AI Customize
    Progress bar template with three steps, indicating the completion status for each step using green, blue, and red colors.
    Add to Wishlist
    Download
    AI Customize
    A slide with a progress bar at 50% completion with multicolored segments and caption areas in a white backdrop with a title.
    Add to Wishlist
    Download
    AI Customize
    PowerPoint Bubble Chart Presentation and Google Slides
    Add to Wishlist
    Download
    AI Customize
    Colorful bar graph infographic slide representing five levels of process maturity, each labeled and iconified with captions.
    Free
    Add to Wishlist
    Download
    AI Customize
    Circular pie chart divided into six color coded sections with percentages, and corresponding numbered captions on both sides.
    Add to Wishlist
    Download
    AI Customize
    Bass Diffusion Model PPT Template and Google Slides
    Add to Wishlist
    Download
    AI Customize
    Five donut shaped progress indicators in various colors with percentage, each with numbered text areas.
    Add to Wishlist
    Download
    AI Customize
    Line graph showing the dunning-kruger effect with peaks and valleys labeled as confidence and competence grow.
    Add to Wishlist
    Download
    AI Customize
    3D Pie Chart PowerPoint Presentation Template