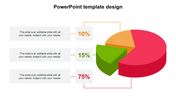
Multicolor Chart Infographic PowerPoint Template

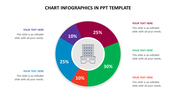
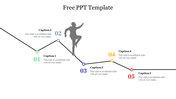
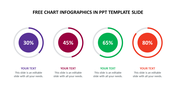

Detailed Chart Infographic Template With Five Nodes
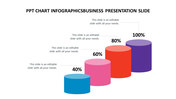
If you want to quickly convey information and distill large amounts of data into an easy-to-understand format, you need our Chart Infographic PowerPoint. It features five eye-catching charts that are guaranteed to draw attention and engage your audience. In addition, the template comes with customizable color options and modern design elements, making it easy to tailor to your needs. With this template, you can easily discuss data-heavy topics and make your information more visually appealing. Also, this template is perfect for showcasing data-focused topics, comparing multiple metrics, or outlining important trends.
Features of the Template
- 100% customizable slides and easy-to-download
- Slides are available in different nodes & colors.
- It comes with a chart theme.
- The slide contains 16:9 and 4:3 formats.
- Easy to change the slide colors quickly.
- It is a well-crafted template with an instant download facility.
- We designed this slide with a stunning design.
- It comes with five nodes.


You May Also Like These PowerPoint Templates

Add to Wishlist
Download
AI Customize

Free
Add to Wishlist
Download
AI Customize

Add to Wishlist
Download
AI Customize

Add to Wishlist
Download
AI Customize

Add to Wishlist
Download
AI Customize

Add to Wishlist
Download
AI Customize

Add to Wishlist
Download
AI Customize

Add to Wishlist
Download
AI Customize

Add to Wishlist
Download
AI Customize

Add to Wishlist
Download
AI Customize

Add to Wishlist
Download
AI Customize


Add to Wishlist
Download
AI Customize

Add to Wishlist
Download
AI Customize

Add to Wishlist
Download
AI Customize

Add to Wishlist
Download
AI Customize

Add to Wishlist
Download
AI Customize

Add to Wishlist
Download
AI Customize

Add to Wishlist
Download
AI Customize
