Waffle Charts

Waffle Charts

30 +

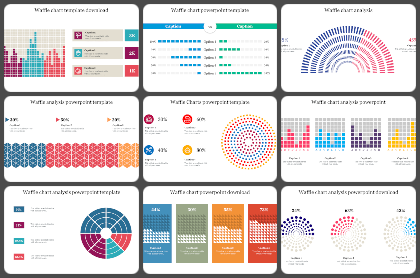
Waffle Charts Presentation Templates

Get ready to compare highly variant numbers with our Free Waffle Charts PowerPoint Templates and Google Slides Themes. The best analysis tool with colorful squares and circles for better understanding. Easy to use and 100% editable ready-made slides. Hurry to grab at Slide Egg!

Add to Wishlist
Download
Colorful waffle chart with segmented blue, teal, red, and orange blocks, surrounded by corresponding percentage captions.
Add to Wishlist
Download
Waffle chart showing three percentages of 43% maroon, 61% red, and 38% yellow, with circles indicating completion.
Add to Wishlist
Download
Pixelated chart with teal, blue, and red columns, and three corresponding caption boxes on the right.
Add to Wishlist
Download
Set of infographic slides with waffle charts in various colors, highlighting data using hexagon patterns and text.
Add to Wishlist
Download
Waffle chart design with circular icons arranged in five rows, color coded in pink, blue, and teal to represent months.
Add to Wishlist
Download
Waffle chart PowerPoint slide displaying percentages with color markers and icons with placeholder text.
Free
Add to Wishlist
Download
Four waffle chart sections show percentages with corresponding captions.
Free
Add to Wishlist
Download
Hexagonal waffle chart with blue, red, and orange sections illustrating proportions and caption areas.
Add to Wishlist
Download
Waffle chart with apple icons in blue, green, orange, and red, paired with four labeled captions areas on the right.
Add to Wishlist
Download
Waffle chart analysis slide with multicolored circular data markers with caption sections.
Add to Wishlist
Download
Four colored waffle charts showing different percentage values with corresponding captions and placeholder text.
Add to Wishlist
Download
Simple Waffle Chart Analysis PowerPoint Download
Add to Wishlist
Download
Slide with four waffle charts, each displaying a percentage with colored square grids in blue, red, orange, and green.
Add to Wishlist
Download
Waffle charts in four colors representing percentages 54% in blue, 70% in green, 60% in orange, and 40% in red.
Add to Wishlist
Download
Semi circular waffle chart with blue and pink segments, illustrating percentage differences in two categories.
Add to Wishlist
Download
Waffle chart slide comparing two categories in blue and green, with percentage based bar visuals for five options.
Add to Wishlist
Download
Waffle Charts PPT PowerPoint Presentation
Add to Wishlist
Download
PowerPoint slide with three waffle charts representing percentages in red, green, and blue sections with captions.
Add to Wishlist
Download
Waffle chart PowerPoint slide with color coded blocks representing different risk levels with captions on a white backdrop.
Add to Wishlist
Download
Waffle Chart PowerPoint Presentation And Google Slides