Demographics

Demographics

48 +

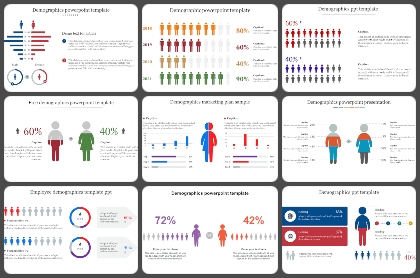
Demographics Presentation Templates

Enhance your presentations with our demographics presentation templates. Present your data effectively with visually appealing Google Slides Themes and PowerPoint templates. Ideal for students, researchers, and professionals.

Add to Wishlist
Download
Slide displaying employee demographics with two groups, using gender neutral icons and corresponding percentage charts.
Add to Wishlist
Download
Download Free Demographics PPT Template and Google Slides
Add to Wishlist
Download
Demographic comparison of male and female data in pink and yellow bars for different age categories.
Add to Wishlist
Download
Infographic showing demographic data with colorful circular pie charts, text boxes, and colored figures in purple and red.
Add to Wishlist
Download
Two figures in orange and yellow representing demographics, with corresponding percentage bars on either side.
Free
Add to Wishlist
Download
 Demographic Segmentation PPT Template & Google Slides
Add to Wishlist
Download
Infographic showing demographic data in a PowerPoint slide with red and blue figures with placeholder text.
Free
Add to Wishlist
Download
Slide displaying gender demographics with a male in green and a female in red representation with percentages.
Add to Wishlist
Download
Demographic themed slides with various charts and icons to visualize population statistics, including male and female ratios.
Add to Wishlist
Download
Three-section layout with purple, green, and red banners summarizing survey objectives with placeholder boxes.
Add to Wishlist
Download
Demographic infographic slide showing four rows of colored icons representing percentages with placeholder text.
Add to Wishlist
Download
Demographic slide with a bar chart, a segmented human icon, and four descriptive boxes to the right.
Add to Wishlist
Download
Demographic PowerPoint slide showing population data across four years with different colored icons representing percentages.
Add to Wishlist
Download
Survey result visualization showing 60% male and 40% female voting intention, displayed with person icons and a chart.
Add to Wishlist
Download
Chart with blue and orange bars representing male and female demographics, along with icons for each gender.
Add to Wishlist
Download
Demography PowerPoint template showcasing percentages with colored figures representing data and placeholder text.
Add to Wishlist
Download
Illustration of demographic data with a blue female icon on the left at 40% and a pink male icon on the right at 60%.
Add to Wishlist
Download
Demographic layout with colored person icons in red and blue, linked with captions and percentage values.
Add to Wishlist
Download
Layout showing blue and red blocks with percentages, a central figure, and step circles for demographic data visualization.
Add to Wishlist
Download
Slide comparing two demographic segments, A and B, with gender icons and corresponding bar charts for three steps.