Effective Business Impact Analysis Presentation Slide

Business analysis bar chart slide with six colored bars representing different activities and percentages with text area.
P.ID : 65486
    1.7K+ views
    162 Downloads
    Get Custom Slides by Experts
    Instantly Access Templates in PowerPoint

    Business Impact Analysis PowerPoint Slide


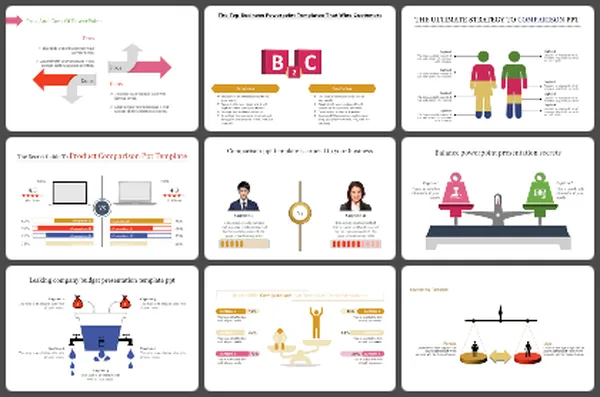
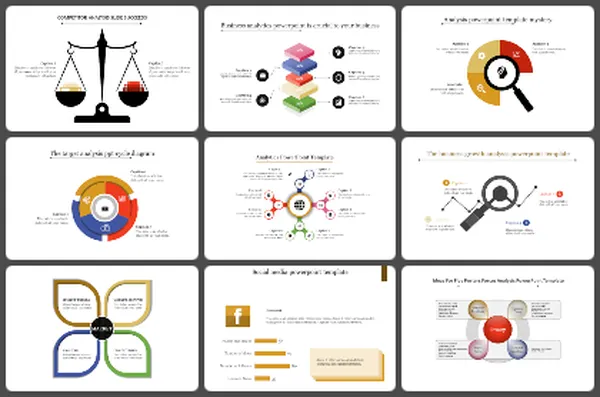
    Download this Business Impact Analysis Presentation Template to make a powerful presentation to visualize and analyze your business impact. Using this analysis slide, you can make impactful business plans . It is a well-designed, ready-made slide that comes with fully editable features.

    About the template:


    The Impact slide has a multicolor bar chart to More...
    Advertisement

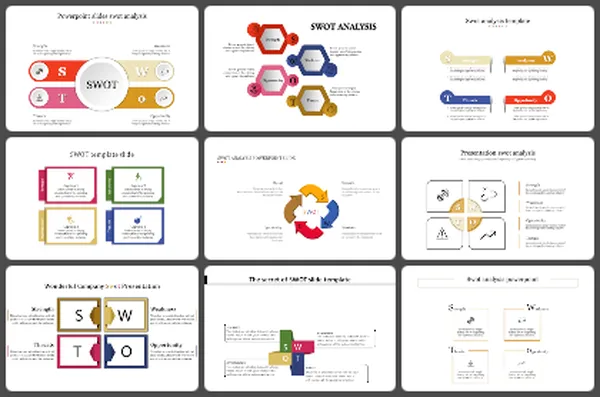
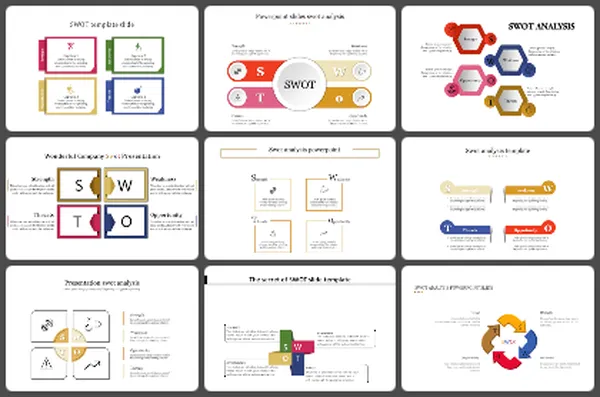
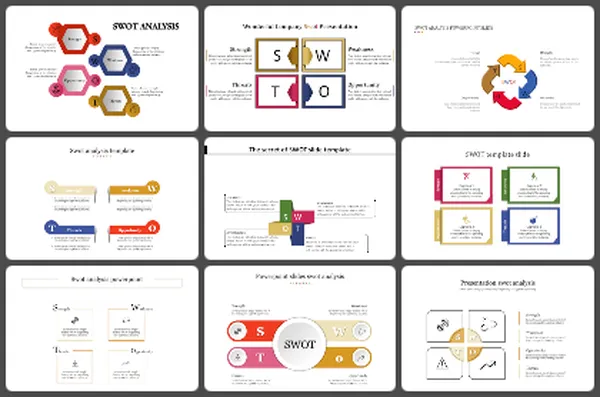
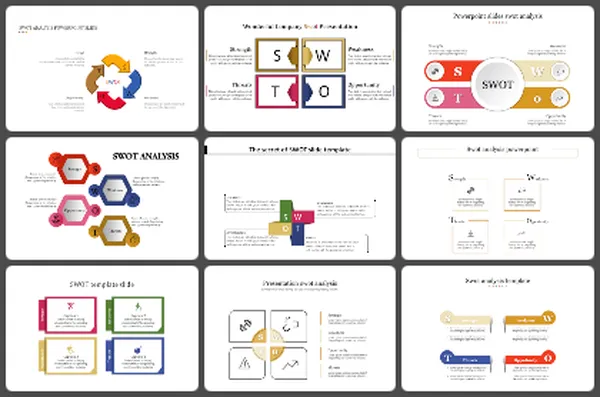
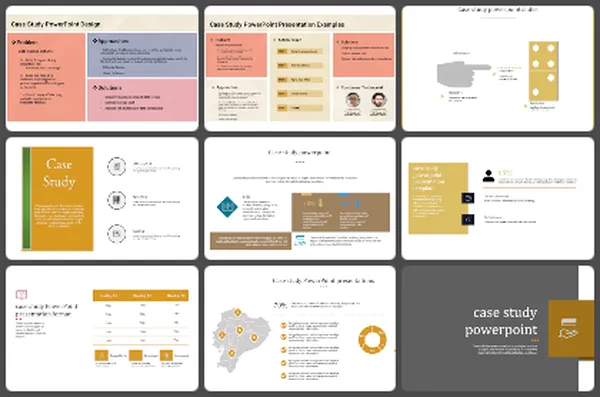
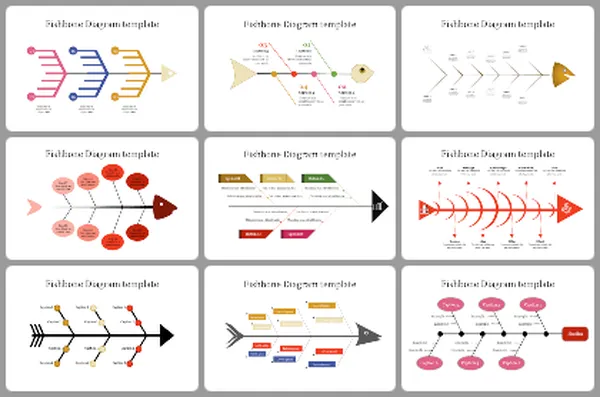
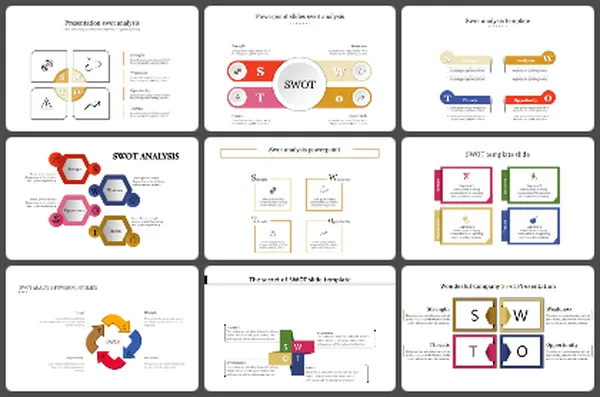
    You May Also Like These PowerPoint Templates

    Free
    Add to Wishlist
    Download
    AI Customize
    Best Scenario Analysis Presentation Template Slides
    Add to Wishlist
    Download
    AI Customize
    Business analytics layout with a central rocket graphic surrounded by cloud shaped icons for five sequential steps.
    Free
    Add to Wishlist
    Download
    AI Customize
    Analysis presentation template with six sections arranged in a yellow circle, each featuring an icon and caption.
    Add to Wishlist
    Download
    AI Customize
    Slide deck featuring multiple analysis templates with colorful layouts, charts, and icons for data representation.
    Add to Wishlist
    Download
    AI Customize
    Analysis PPT slide with four colorful text boxes and unique icons for each stage of the process with captions.
    Add to Wishlist
    Download
    AI Customize
    Slide deck with coloful infographics and diagrams explaining target market analysis, segments, and customer base analysis.
    Free
    Add to Wishlist
    Download
    AI Customize
    Circular analysis diagram featuring six purple sections with icons like a target and gear, arranged around a black bar chart.
    Add to Wishlist
    Download
    AI Customize
    Analysis PowerPoint slide featuring a hexagonal internal analysis core and six colorful surrounding icons with labels.
    Add to Wishlist
    Download
    AI Customize
    Performance template with four linked circles labeled from finance to business processes, each with bullet points and icons.
    Add to Wishlist
    Download
    AI Customize
    Yellow pie chart divided into Analysis 1, 2, and 3 segments, focused by a black magnifying glass icon.
    Free
    Add to Wishlist
    Download
    AI Customize
    Blue themed slide with two square icons on tilted diamonds and two rectangular caption boxes on the right.
    Free
    Add to Wishlist
    Download
    AI Customize
    Four triangular icons in yellow, pink, purple, and red, showing percentages, with gray caption boxes below.
    Add to Wishlist
    Download
    AI Customize
    Colorful pie chart with a man holding a pencil, surrounded by directional arrows, symbolizing analysis and decision making.
    Add to Wishlist
    Download
    AI Customize
    Colorful circular analysis template featuring six sections with icons growth, target, people, settings, data, and analytics.
    Add to Wishlist
    Download
    AI Customize
    Graph with three numbered curves in green, orange, and red, with corresponding text on the right.
    Free
    Add to Wishlist
    Download
    AI Customize
    Analysis PPT slide showing a phone with a checklist and icons with multiple captions with text descriptions.
    Add to Wishlist
    Download
    AI Customize
    Slide featuring a five step process for performance with matching icons for each phase.
    Free
    Add to Wishlist
    Download
    AI Customize
    Business analysis slide featuring profile cards in blue and white, with four icons and captions on the right.
    Add to Wishlist
    Download
    AI Customize
    Blue infographic with location pins displaying percentages for market analysis, arranged in a triangular layout.