Amazing Business Growth Presentation Template Design

 Canva
Canva
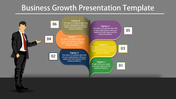


Business Growth Presentation Template
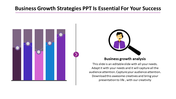
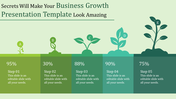
In today's fast-paced business environment, showcasing your company's growth and future potential is crucial for gaining stakeholder confidence. Our "Business Growth Presentation Template" provides the perfect platform to highlight your strategic plans, achievements, and projections in a visually compelling way.
Slide Description:
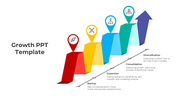
Our template features a horizontal chart representing the growth of an organization over time. The horizontal axis represents time, while the vertical axis represents the organization’s size or progress. The chart is divided into six vertical sections, each labeled with a different aspect of business operations: Create, Manage, Delegate, Co-ordinate, Collaborate, and Alliance. Along the diagonal line representing growth, there are circles with Leadership (at the beginning), Autonomy, Control, Red tape, and Growth (at the end).
Purpose of this slide:
To visually present various stages of business development and strategies that can be employed at each stage.
Who can benefit?
Managers, Team leaders, Strategists, and anyone involved in planning and executing business growth strategies
Download our templates now and start creating impactful presentations that resonate with your audience.
Features of the template:
- Slides are available in 4:3 & 16:9
- Get slides that are 100% customizable and easy to download
- Highly compatible with PowerPoint and Google Slides


You May Also Like These PowerPoint Templates
Add to Wishlist
Download
AI Customize

Add to Wishlist
Download
AI Customize

Free
Add to Wishlist
Download
AI Customize

Add to Wishlist
Download
AI Customize

Add to Wishlist
Download
AI Customize

Add to Wishlist
Download
AI Customize


Add to Wishlist
Download
AI Customize

Add to Wishlist
Download
AI Customize

Add to Wishlist
Download
AI Customize


Add to Wishlist
Download
AI Customize


Add to Wishlist
Download
AI Customize

Add to Wishlist
Download
AI Customize

Add to Wishlist
Download
AI Customize

Free
Add to Wishlist
Download
AI Customize

Add to Wishlist
Download
AI Customize

Free
Add to Wishlist
Download
AI Customize
