Budget Vs Expense Vs Savings PowerPoint And Google Slides
 Canva
Canva

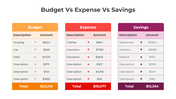
Budget Vs Expense Vs Savings PPT, Google Slides, and Canva Template
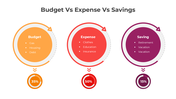
When managing personal or business finances, understanding the key differences between budget, expense, and savings is essential. A budget is a financial plan that outlines how income will be allocated across various categories, including spending and saving. Expenses refer to the actual outflows of money used to cover costs such as bills, rent, utilities, and other living or operational costs. Savings, on the other hand, is the portion of income that is set aside for future use, often in a bank account or investment and is not spent immediately.
Purpose Of The Slides
This "Budget Vs Expense Vs Savings" PPT template is designed to help you understand the relationships between these financial components. It is ideal for business professionals, students, or anyone seeking a clear and easy-to-understand comparison. This deck covers budgeting strategies, managing expenses, and the importance of savings in achieving financial goals.
Who Can Use It?
- Business Professionals: Use the template to present financial plans and strategies for managing expenses and increasing savings.
- Students: Learn the basics of financial management, helping to make smarter personal or business decisions.
- Individuals: Understand the importance of balancing budget, expenses, and savings to achieve long-term financial stability.
Special Key Features
This 11-slide deck is fully customizable, featuring a vibrant multicolor theme and unique images that make complex financial concepts easier to digest.
Download the "Budget Vs Expense Vs Savings" template now and begin mastering your financial future with a clear, concise presentation tool!
Features of this template
- 100% customizable slides and easy to download.
- The slides contain 16:9 and 4:3 formats.
- It is easy to change the colors quickly.
- Highly compatible with PowerPoint, Google Slides, and Canva templates.


You May Also Like These PowerPoint Templates
Add to Wishlist
Download
AI Customize

Add to Wishlist
Download
AI Customize

Add to Wishlist
Download
AI Customize

Add to Wishlist
Download
AI Customize

Add to Wishlist
Download
AI Customize

Add to Wishlist
Download
AI Customize

Add to Wishlist
Download
AI Customize

Add to Wishlist
Download
AI Customize

Add to Wishlist
Download
AI Customize


Free
Add to Wishlist
Download
AI Customize

Add to Wishlist
Download
AI Customize

Add to Wishlist
Download
AI Customize

Add to Wishlist
Download
AI Customize

Add to Wishlist
Download
AI Customize

Add to Wishlist
Download
AI Customize

Add to Wishlist
Download
AI Customize

Add to Wishlist
Download
AI Customize

Add to Wishlist
Download
AI Customize

