Editable Bubble Scatter PowerPoint Slide With Two Node


Innovative Bubble Scatter Graph PowerPoint PPT Template
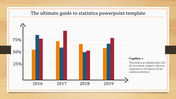
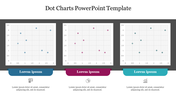
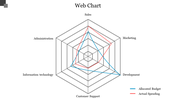
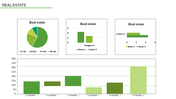
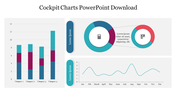
Want a PowerPoint chart in which the data points are replaced with bubbles? Get Bubble Scatter PowerPoint PPT Template. This chart template will help you to explain important information about your Analysis. This template is used to compare two sets of information. It also has two Bubble Scatter that helps you present important information to the audience. The Bubble Scatter chart on the slide will help the audience to get an idea about your core content. In addition, We also have a wide range of Chart presentation slides. Also, This Bubble Scatter PowerPoint PPT Template is 100% editable. For example, you can change the icon colors in this PowerPoint slide.
Features of this template:
- It is a pre-built design to save time.
- Fully Customizable (shape color, size & text)
- This template has a Bubble theme.
- Drag and drop image placeholder
- Huge Collections of chart slides to impress your audience
- It supports an aspect ratio of 16:9 and 4:3 format


You May Also Like These PowerPoint Templates
Add to Wishlist
Download
AI Customize

Add to Wishlist
Download
AI Customize

Add to Wishlist
Download
AI Customize

Add to Wishlist
Download
AI Customize

Add to Wishlist
Download
AI Customize

Add to Wishlist
Download
AI Customize

Add to Wishlist
Download
AI Customize

Add to Wishlist
Download
AI Customize

Add to Wishlist
Download
AI Customize

Add to Wishlist
Download
AI Customize

Add to Wishlist
Download
AI Customize

Add to Wishlist
Download
AI Customize

Add to Wishlist
Download
AI Customize

Add to Wishlist
Download
AI Customize

Add to Wishlist
Download
AI Customize

Add to Wishlist
Download
AI Customize

Add to Wishlist
Download
AI Customize

Add to Wishlist
Download
AI Customize

Add to Wishlist
Download
AI Customize

Free
Add to Wishlist
Download
AI Customize
