Imaginative Break Even Analysis PowerPoint And Google Slides


Creative Break Even Analysis PowerPoint Template
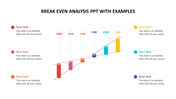
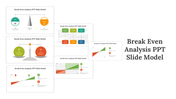
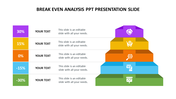
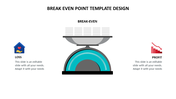
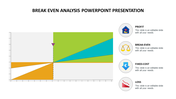
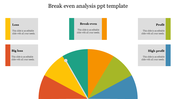
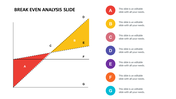
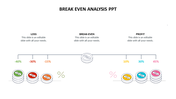
This method gives the fixed price for a product which can determine the number of products you must sell before gaining the profit, excluding the total creating charges. It calculates the cost of a new product or service to unit sell price to determine the break-even in your profit. This gives your answer for the amount required for the total product cost and the amount to cover the total charges for releasing a new product. So the template can help you evaluate and analyze product charges and decide accordingly. The four nodes with comprehending icons give the idea based on their design on each topic. The customizable features can make the presentation a success with these editable features. Download now and make it a success.
Features of this Template
- 100% customizable slides and easy to download.
- The slide contains 16:9 and 4:3 formats.
- Easy to change the colors of the slide quickly.
- Highly compatible with PowerPoint and Google Slides.


You May Also Like These PowerPoint Templates
Add to Wishlist
Download
AI Customize

Add to Wishlist
Download
AI Customize

Add to Wishlist
Download
AI Customize

Add to Wishlist
Download
AI Customize

Add to Wishlist
Download
AI Customize


Add to Wishlist
Download
AI Customize


Add to Wishlist
Download
AI Customize

Add to Wishlist
Download
AI Customize

Add to Wishlist
Download
AI Customize

Add to Wishlist
Download
AI Customize

Add to Wishlist
Download
AI Customize


Add to Wishlist
Download
AI Customize

Add to Wishlist
Download
AI Customize

Add to Wishlist
Download
AI Customize

Add to Wishlist
Download
AI Customize

Add to Wishlist
Download
AI Customize
