Use Break Even Analysis PPT Presentation Templates

Slide displays a break even analysis with sections for loss, break even, and profit, with percentages and coin illustrations.
P.ID : 50078
    142 views
    13 Downloads
    Get Custom Slides by Experts
    Instantly Access Templates in PowerPoint

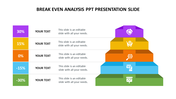
    Eye-catching Break even PPT

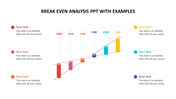
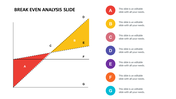
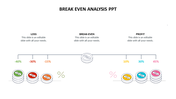
    In economics, cost accounting, and business, break-even analysis refers to the situation where total cost and revenue are equal. The quantity of products or dollars of sales required to cover all costs is calculated using template point analysis. This three-noded, colorful template with dollars will be more eye-catching and transport your audience to a world of fantasy wealth. This template will benefit significantly from being simple to change and adaptable. Grab it right away to create a successful presentation.

    Features of the template

    •  100% customizable slides and easy to download.
    •  Slides are available in different nodes & colors.
    •  The slide contained 16:9 and 4:3 formats.
    •  Easy to change the slide colors quickly.
    •  Well-designed template with instant download facility.
    • It has a clean image of colorful Break even PPT.
    Advertisement

    You May Also Like These PowerPoint Templates

    Add to Wishlist
    Download
    AI Customize
    A colorful break even point chart slide highlighting six key financial statuses from reduced costs to high profit with text.
    Add to Wishlist
    Download
    AI Customize
    Break even analysis slide with a colorful semicircular gauge and text sections on both sides.
    Add to Wishlist
    Download
    AI Customize
    Balance scale graphic with red and green percentage indicators, showing loss on the left and profit on the right.
    Add to Wishlist
    Download
    AI Customize
    Break even analysis PowerPoint template diagrams
    Free
    Add to Wishlist
    Download
    AI Customize
    Horizontal line with five circular icons in red, pink, purple, blue, and yellow, representing different financial stages.
    Free
    Add to Wishlist
    Download
    AI Customize
    Best Break Even PowerPoint Slide With Editable Graph
    Add to Wishlist
    Download
    AI Customize
    Diagram illustrating a break-even point analysis with profit and loss regions meeting at a central break-even marker.
    Free
    Add to Wishlist
    Download
    AI Customize
    Slide featuring a break-even point chart in orange, red, and purple sections, with text areas on the left and right.
    Add to Wishlist
    Download
    AI Customize
    Break even analysis slide with stacked bars in green, orange, red, and yellow, surrounded by cost and revenue icons.
    Add to Wishlist
    Download
    AI Customize
    Break-even analysis graphic showing a green scale balancing two large colored circles.
    Free
    Add to Wishlist
    Download
    AI Customize
    Customized Break Even Analysis PPT Free Download Slide
    Add to Wishlist
    Download
    AI Customize
    Semi circle gauge with five color coded segments from green to gray, and a central black pointer showing financial range.
    Add to Wishlist
    Download
    AI Customize
    Break even analysis slide with three charts representing different stages with placeholder text.
    Add to Wishlist
    Download
    AI Customize
    Break even analysis powerpoint presentation design