Best Break Even Analysis PowerPoint Presentation Download

Semi circle gauge with five color coded segments from green to gray, and a central black pointer showing financial range.
P.ID : 50054
    171 views
    20 Downloads
    Get Custom Slides by Experts
    Instantly Access Templates in PowerPoint

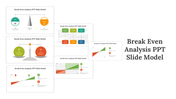
    Professional Break Even Analysis Template

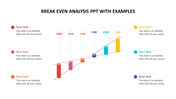
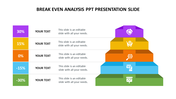
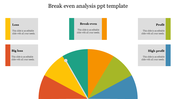
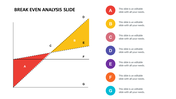
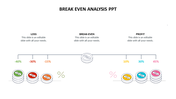
    Break-even analysis is the term used in accounting, investing, and marketing. You can share the results nicely with our SlideEgg. Our professional designers usually make their work fantastic. Here arc-like graphic design is added, and the semicircle model slide with five divisions helps in showing the break-even analysis interestingly. In this slide, a pointer needle is added, and captions are added in the five parts to show the loss, profit, break-even point, big loss, and big profit. You can elaborate or add reasons for those under the caption within the semicircle model. Download now to give a fantastic break even presentation.

    Features of the template

    • 100% customizable slides and easy to download.
    • Slides are available in different nodes & colors.
    • The slide contains 16:9 and 4:3 formats.
    • Easy to change the colors of the slide quickly.
    • Well-crafted template with instant download facility.
    • High-definition graphics with icons.
    Advertisement

    You May Also Like These PowerPoint Templates

    Add to Wishlist
    Download
    AI Customize
    A colorful break even point chart slide highlighting six key financial statuses from reduced costs to high profit with text.
    Add to Wishlist
    Download
    AI Customize
    Break even analysis slide with a colorful semicircular gauge and text sections on both sides.
    Add to Wishlist
    Download
    AI Customize
    Balance scale graphic with red and green percentage indicators, showing loss on the left and profit on the right.
    Add to Wishlist
    Download
    AI Customize
    Break even analysis PowerPoint template diagrams
    Free
    Add to Wishlist
    Download
    AI Customize
    Horizontal line with five circular icons in red, pink, purple, blue, and yellow, representing different financial stages.
    Free
    Add to Wishlist
    Download
    AI Customize
    Best Break Even PowerPoint Slide With Editable Graph
    Add to Wishlist
    Download
    AI Customize
    Diagram illustrating a break-even point analysis with profit and loss regions meeting at a central break-even marker.
    Free
    Add to Wishlist
    Download
    AI Customize
    Slide featuring a break-even point chart in orange, red, and purple sections, with text areas on the left and right.
    Add to Wishlist
    Download
    AI Customize
    Break even analysis slide with stacked bars in green, orange, red, and yellow, surrounded by cost and revenue icons.
    Add to Wishlist
    Download
    AI Customize
    Break-even analysis graphic showing a green scale balancing two large colored circles.
    Free
    Add to Wishlist
    Download
    AI Customize
    Customized Break Even Analysis PPT Free Download Slide
    Add to Wishlist
    Download
    AI Customize
    Semi circle gauge with five color coded segments from green to gray, and a central black pointer showing financial range.
    Add to Wishlist
    Download
    AI Customize
    Break even analysis slide with three charts representing different stages with placeholder text.
    Add to Wishlist
    Download
    AI Customize
    Break even analysis powerpoint presentation design