Use Break Even Analysis Infographics PPT And Google Slides

Pack of 36 slides
P.ID : 69695
Advertisement
310 views
79 Downloads
Get Custom Slides by Experts
Instantly Access Templates in PowerPoint

Break Even Analysis Infographics PPT And Google Slides

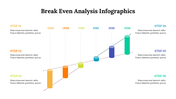
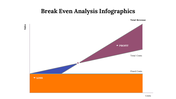
Your break-even analysis is ready! You're sure sales are going to be great as soon as you use our fabulous slides. We've got them in different shapes and sizes for each style of break-even analysis. Our infographics will help you picture your numbers at a glance so that everyone at the next business meeting can grasp what they mean. 

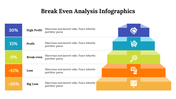
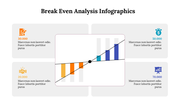
If you want to report an analysis of how your company is performing, then you need an infographic that explains it clearly. Slide Egg's this bundle of slides will enable you to do exactly that. It has been crafted to help you explain each step in a visually engaging way. Also, an actual point is different from what is shown in the table. Don't doubt its effectiveness! 

Features of the template

  • 100% customizable slides and easy to download.
  • Slides are available in different nodes & colors.
  • The slide contains 16:9 and 4:3 formats.
  • Easy to change the slide colors quickly.
  • Well-crafted template with an instant download facility.
  • Infographics in all 36 slides.

You May Also Like These PowerPoint Templates

Free
Add to Wishlist
Download
AI Customize
SWOT PowerPoint template slide with a focus on threats, featuring a bomb icon with placeholder text.
Free
Add to Wishlist
Download
AI Customize
SWOT analysis template with four purple boxes, each containing an icon and text placeholders.
Add to Wishlist
Download
AI Customize
SWOT template with four purple ribbon-shaped segments arranged around a dark purple vertical base, placed in white backdrop.
Free
Add to Wishlist
Download
AI Customize
SWOT analysis with wavy red lines connecting each letter, aligned icons and descriptions on both sides.
Add to Wishlist
Download
AI Customize
Illustration of a break even analysis with a balanced scale, showing percentages in circular shapes on either side.
Add to Wishlist
Download
AI Customize
Color-coded break-even analysis with bars from 10M to 30M along a rising dotted line and text areas for values.
Add to Wishlist
Download
AI Customize
The best break even analysis ppt template model
Add to Wishlist
Download
AI Customize
Break Even Analysis slides showing various models, charts, and graphics for loss, profit, and break even points with icons.
Add to Wishlist
Download
AI Customize
Visual representation of break-even analysis using a colorful stacked pyramid with percentage indicators.
Add to Wishlist
Download
AI Customize
Top-Notch Break Even Point Template Design For Your Need
Add to Wishlist
Download
AI Customize
Break even analysis chart showing a profit, break even, fixed cost, and loss in different colored sections on a white theme.
Add to Wishlist
Download
AI Customize
Break even analysis dashboard with a color coded meter chart displaying profit and loss categories.
Add to Wishlist
Download
AI Customize
Effective Break Even Analysis Slide For Presentation
Add to Wishlist
Download
AI Customize
Slide displays a break even analysis with sections for loss, break even, and profit, with percentages and coin illustrations.
Add to Wishlist
Download
AI Customize
A colorful break even point chart slide highlighting six key financial statuses from reduced costs to high profit with text.
Add to Wishlist
Download
AI Customize
Break even analysis slide with a colorful semicircular gauge and text sections on both sides.
Add to Wishlist
Download
AI Customize
Balance scale graphic with red and green percentage indicators, showing loss on the left and profit on the right.
Add to Wishlist
Download
AI Customize
Break even analysis PowerPoint template diagrams
Free
Add to Wishlist
Download
AI Customize
Horizontal line with five circular icons in red, pink, purple, blue, and yellow, representing different financial stages.
Free
Add to Wishlist
Download
AI Customize
Best Break Even PowerPoint Slide With Editable Graph
Add to Wishlist
Download
AI Customize
Diagram illustrating a break-even point analysis with profit and loss regions meeting at a central break-even marker.
Free
Add to Wishlist
Download
AI Customize
Slide featuring a break-even point chart in orange, red, and purple sections, with text areas on the left and right.
Add to Wishlist
Download
AI Customize
Break even analysis slide with stacked bars in green, orange, red, and yellow, surrounded by cost and revenue icons.
Add to Wishlist
Download
AI Customize
Break-even analysis graphic showing a green scale balancing two large colored circles.
Free
Add to Wishlist
Download
AI Customize
Customized Break Even Analysis PPT Free Download Slide
Add to Wishlist
Download
AI Customize
Semi circle gauge with five color coded segments from green to gray, and a central black pointer showing financial range.
Add to Wishlist
Download
AI Customize
Break even analysis slide with three charts representing different stages with placeholder text.
Add to Wishlist
Download
AI Customize
Break even analysis powerpoint presentation design