Bradley Curve PowerPoint Presentation and Google Slides

Bradley curve chart with four sections in shades of maroon, and orange, illustrating progression through stages.
P.ID : 60537
    1.6K+ views
    307 Downloads
    Get Custom Slides by Experts
    Instantly Access Templates in PowerPoint

    Radiant Bradley Curve Template Presentation Design


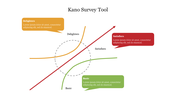
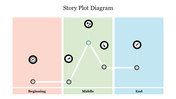
    This Radiant Bradley Curve Template Presentation Design is one of the great graph templates from SlideEgg. This graph presentation template aids you in representing the data in a graphical way. This is a three nodded template. 

    This template has a clipart diagram of the Bradley curve graph in the top region. The four nodes are horizontally arranged on the bottom region of this template. Use this analysis graph template to leave an ever-lasting impression on your audience. Grab now!!!

    Features of the template:

    • 100% customizable slides and easy to download.
    • Slides available in different nodes & colors.
    • The slide contained 16:9 and 4:3 format.
    • Easy to change the slide colors quickly.
    • Well-crafted template with instant download facility.
    • Pre-designed template with three nodded features.
    • Effective and powerful graphical representation.
    Advertisement

    You May Also Like These PowerPoint Templates

    Free
    Add to Wishlist
    Download
    AI Customize
    Creative Graph Template For PPT Presentation
    Add to Wishlist
    Download
    AI Customize
    Unique Chart Presentation For Your Creative Presentation
    Free
    Add to Wishlist
    Download
    AI Customize
    Bar Chart PowerPoint Templates and Google Slides Themes
    Free
    Add to Wishlist
    Download
    AI Customize
    PPT Charts and Graphs Template Presentation & Google Slides
    Free
    Add to Wishlist
    Download
    AI Customize
    Elegant PowerPoint Charts and Graphs Template and Google Slides
    Free
    Add to Wishlist
    Download
    AI Customize
    We have the Best Collection of Chart Presentation Slides
    Add to Wishlist
    Download
    AI Customize
    Slide showing a graph of the Dunning-Kruger Effect with stages from knowing nothing to becoming an expert with a title text.
    Add to Wishlist
    Download
    AI Customize
    Narrative arc slide displaying key plot stages with placeholder text areas.
    Add to Wishlist
    Download
    AI Customize
    Line graph slide with two data series in red and yellow, showing item based data fluctuations and a text caption.
    Add to Wishlist
    Download
    AI Customize
    Graph showing an upward curve with captions along key points, indicating growth or improvement over time.
    Add to Wishlist
    Download
    AI Customize
    Curve Graph PPT Template & Google Slides for Presentation
    Add to Wishlist
    Download
    AI Customize
    A collection of story arc slides featuring graphs illustrating rising action, climax, and resolution points for storytelling.
    Add to Wishlist
    Download
    AI Customize
    An S shaped curve graph with three key points, illustrating growth or change over time with captions.
    Add to Wishlist
    Download
    AI Customize
    Best Positively Skewed Histogram Presentation Slide
    Add to Wishlist
    Download
    AI Customize
    A bell curve chart slide with an orange shaded area representing percentages for standard deviations.
    Add to Wishlist
    Download
    AI Customize
    A four quadrant graph with colorful sections labeled from 01 to 04 in the center. Each quadrant has placeholder text area.
    Add to Wishlist
    Download
    AI Customize
    Graph representation of the Dunning Kruger effect, mapping confidence levels from know nothing to expert across four stages.