Want to keep your project on track? Gantt charts are the perfect tool to help the project progress. A huge perspective of project management is that it helps to remain organized. One powerful tool is the Gantt chart. Gantt charts have developed to become a continuous checklist for tracking project progress and to assure project completion on time. This blog discusses how to use Gantt charts in project report PPT to boost your project management efforts.
Definition of a Gantt Chart
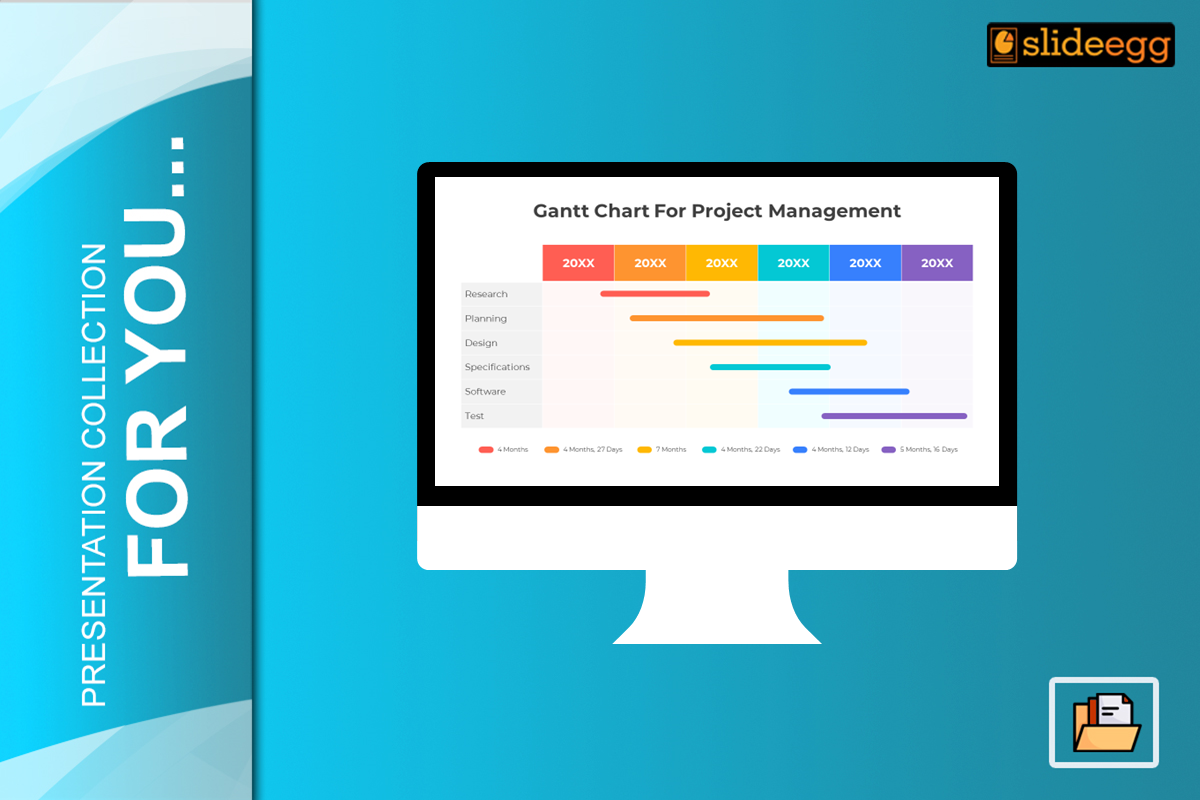
A Gantt chart is nothing but a schematic representation of a project schedule. It illustrates the start and finish dates of certain project components. All the activities are described in the form of bars running across a timeline so that it will help to observe the timing and order of tasks. In understanding project timelines, dependencies, and steps to meet significant milestones, Gantt charts play a critical role.
Benefits of Using a Gantt Chart in Status Reports
Visual Overview of Project Progress
One of the primary uses of Gantt chart PPT is to provide a clear visual summary of the progress of a project. In the Project Management Institute survey, it emerged that during the execution of projects, 80% of the high performers used some form of visual project management tool—such as the Gantt chart—to track project progress and manage schedules. This visual representation offers clarity to stakeholders to easily understand the state of a project and avoid delays that could have been incurred.
Effective Communications
Gantt charts help to create an effective mode of communication among all members and stakeholders. It provides a simple way to describe the complex scheduling information, and hence it becomes easy for everyone to understand the progress task. How it is going on and which should be taken care of? In such a way, it aligns all the expectations and keeps everyone on the same page.
Identification of Dependencies
The Gantt charts also help in identifying the dependencies among tasks, that is, one has to be completed before another one can begin. It is important as far as resources are concerned and for proper alignment of the project phases. Another way in which we can represent this is in the form of a chart that may save you from bottlenecks and create better flow through the project.
How to Make, a Good Gantt Chart for Your Report
Define the tasks of your project
Start by listing all the tasks that need to be completed for the project. Break down larger tasks into smaller, manageable subtasks if necessary. Be thorough in detailing each task to avoid overlooking any crucial components.
Set Start and End Dates
Establish start and end dates for every task. This will make your timeline more realistic and ensure that there is enough time for each activity. You may want to refer to similar projects or historical information to set good reference timelines.
Dependencies Definition
Identify and map the dependencies between tasks: For instance, if the requirement to commence work of another task is the completion of Task A, make sure to have this reflected in your Gantt chart. This helps in understanding the flow and sequence of work.
Assign Resources
Also, the allocation of resources to a particular task involves the identification of personnel, tools, equipment, materials, or supplies that would be needed. This helps in keeping track of who is responsible for what, and everything goes on smoothly by the use of available resources efficiently. Resource allocation may also bring to light where there might be a need for backup.
Regular Updates
A Gantt chart never remains static; it needs to be updated periodically to reflect the project’s real status. Update the chart for any time variances, task-completion variances, or resource allocations. Continuous updating ensures the chart remains relevant to the project’s current status.
How to Use a Gantt Chart Effectively
Keep It Simple
While the temptation is overpowering to include the minutiae of everything, simplicity is the rule. The trick here is to only point out crucial jobs and milestones; excessive detailing will do nothing more than just clutter the chart. A lean and crisp Gantt chart imparts progress and manages tasks in a better way.
Colour Coding
Apply colour coding on types of tasks, statuses, or teams to easily distinguish different ones. For instance, a project may have such categories as completed, in progress, and upcoming. The use of colour will help make this a lot easier to understand with a brief look.
Add Milestones
Add milestones to your Gantt chart to outline significant points or achievements in the project status template. Milestones enable you to track progress and to keep on celebrating the big achievements. This can lift team spirit and enthusiasm.
Use Tools/Software
Use project management software that includes a Gantt chart, developed with and dynamically linked to task lists. Tools like Microsoft Project, Asana, and Smartsheet provide advanced features for both the development and updating of Gantt charts, integration with other functions of project management, and sharing with stakeholders.
Conclusion
In project management, a Gantt chart is the greatest asset, especially if used effectively in status reports. Observation of a project’s timeline through a Gantt chart makes communication clearer, helps track the progress done, and increases efficient management of resources. By following the steps and tips above, you can successfully create and apply the Gantt chart to your projects. Deliver the ideas even better by using templates from SlideEgg.