Effective project status reporting is about providing the right information quickly and helping executives steer projects toward successful completion. Project status reports for executives are important documents that would ensure transparency, accountability, and informed decisions. Executives need compact information relevant to the health of the project to set or reset strategies. Here’s how you can create an effective project report PPT for executives.
Find Your Audience?
Know What They Need
Executives are usually concerned about the health of the project, key milestones, risks, and financials. They prefer high-level summaries and not detailed technical information.
Concise Output
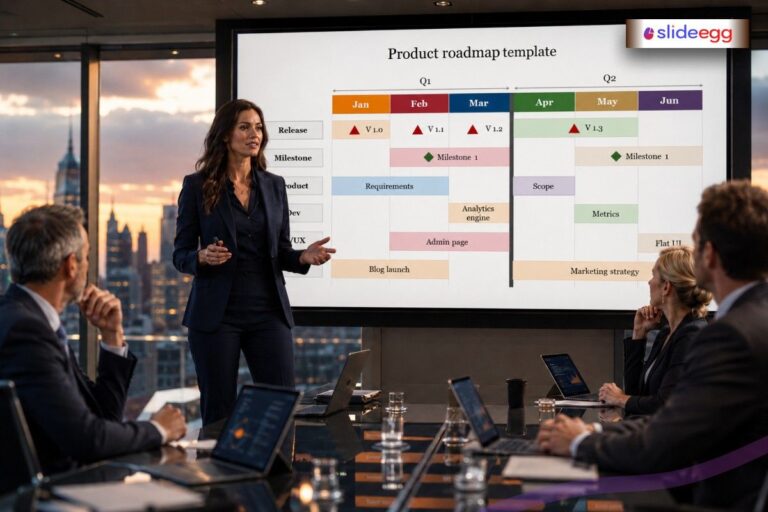
The report needs to be brief and at the same time complete about the most important aspects of the project. Presentations can be a powerful tool here, allowing you to deliver a one-page summary slide with supporting slides available for deeper understanding if needed.
Key Components of Executive Project Status Report
Executive Summary
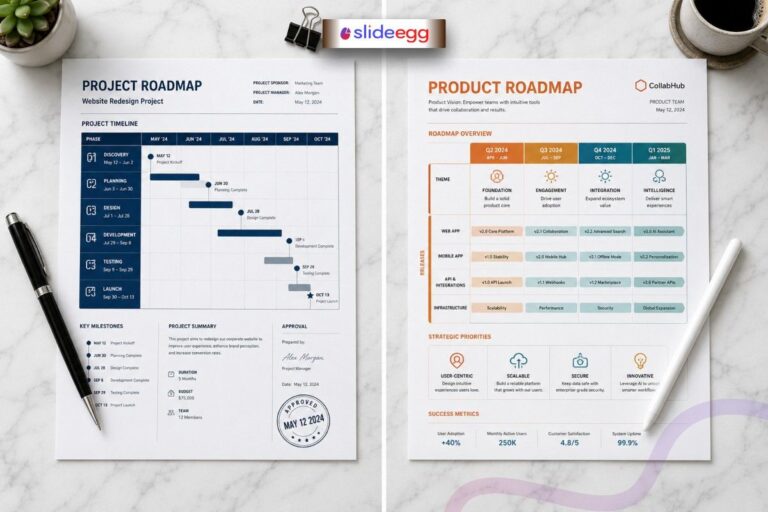
This section provides a high-level view of the current state of the project, key accomplishments, near-term milestones, and critical problems or risks. It should provide a basic answer to the question “Is this project on track?”. For example, include a pie chart presentation to show the percentage of milestones completed versus pending.
Project Health Overview
- Baseline Current Status: Using a color indicator, Green, Yellow, or Red, showing the health status of the project presentation.
- Key Metrics: Include metrics of the project that are of core importance to it, for example, budget adherence, timeline progress, and scope status.
- Budget Status: “The program is within budget, having spent 75% of the funds allocated to the program as of August 2024.”
- Timeline Progress: “The project is 60% complete, with all key milestones achieved on time.”
Milestone Progress
- Achievements: Majorly identify those milestones achieved since the last report.
- Upcoming Milestones: Outline what the upcoming key milestones are, and indicate when they are likely to be completed.
Risk and Issue Management
Top Risks
State the top three to five risks, the potential impact, and mitigation strategies in place. An example would be, “Risk: Potential delay in supplier’s delivery; Mitigation: Secured secondary supplier.”
Current Issues
Any current issues, their impact on the project, and how they are being resolved. Consider a bullet-point list or a creative flowchart presentation to help in quickly grasping the issue and its resolution status.
Financial Summary
Budget Overview: Report on the summary of the status of the budget by including the total budget, spent to date, and forecasted expenditure. A pie chart presentation can help to provide the issue regarding the resolution of the project.
Cost Variance: List any key cost variance, its nature, and the reasons for it.
Team and Resource Updates
Team Performance
Any outstanding results at the team level or changes therein. The use of bullet points or infographics presentation helps to highlight key contributions or changes in team structure.
Resource Allocation
Resource allocation update and any changes to resource allocation to serve the needs of the project.
Best Practices for Reporting
Use Visualization: Incorporate charts, graphs, and dashboards into your presentation to make data more digestible. This will make the information easy to consume for the executives at a glance.
Be Transparent: Provide honest and transparent updates, especially about risks and issues. It will build trust and allow the executives to take precautions for such challenges.
Tailor the Content: Customize your presentation based on the executives’ preferences and the project’s needs. Some may prefer more financial details, while others focus on risk management.
Regular Updates: It should be regular, perhaps weekly or biweekly. Consistency allows executives to track progress over time and know when the next report will come out.
Leverage Technology: Use presentation software to streamline the reporting process. Tools like Microsoft PowerPoint, Google Slides, or specialized project management software can help automate data collection and presentation, ensuring accuracy and efficiency.
Conclusion
Effective project status reporting to executives is to give them what they need to know and decide by being very clear about key metrics, milestones, risks, and financials. By focusing on key metrics, milestones, risks, and financials and using presentations to visualize this information, you can provide executives with the insights they need to make informed decisions. With these strategies, your project status template reports will not only inform; but provide the proper output needed for your project’s success.