
Have you ever encountered a problem that keeps coming back no matter how often you fix it? The truth is, sometimes the real issue lies deeper than it seems. That’s where the 5 Whys technique, paired with a clear and engaging infographic, can help uncover the root cause and lead to lasting solutions.
What is the 5 Whys Technique?
The 5 Whys analysis method allows one to reach back and identify the root cause of an issue. You repeatedly ask ” why ” to get beyond symptoms to the fundamental cause.
For example,
If a machine doesn’t work:
Why did it stop? – The circuit overloaded.
Why did the circuit overload? – The machine was operating over capacity.
Why was it operating over capacity? – The machine wasn’t maintained on schedule.
The process continues until the root cause has been determined.
Why Use 5 Why Infographics in Presentations?
It’s documented that visual aids like infographics will improve information retention and comprehension. The 5 Why Template PPT will help to walk your audience through each stage of the problem-solving process. Rather than overwhelming the audience with verbose explanations, you can visually depict the logic behind each “why,” thus making it easier to tag along.
Including a 5 Why Analysis to Help You:
Present complex issues in an enlightening and structured manner, and impress your audience with a layout that’s easy on the eyes. Simplify the process involved in solving a problem by reducing it to steps. A few easy steps ensure it communicates your message effectively. Here’s how to structure it:
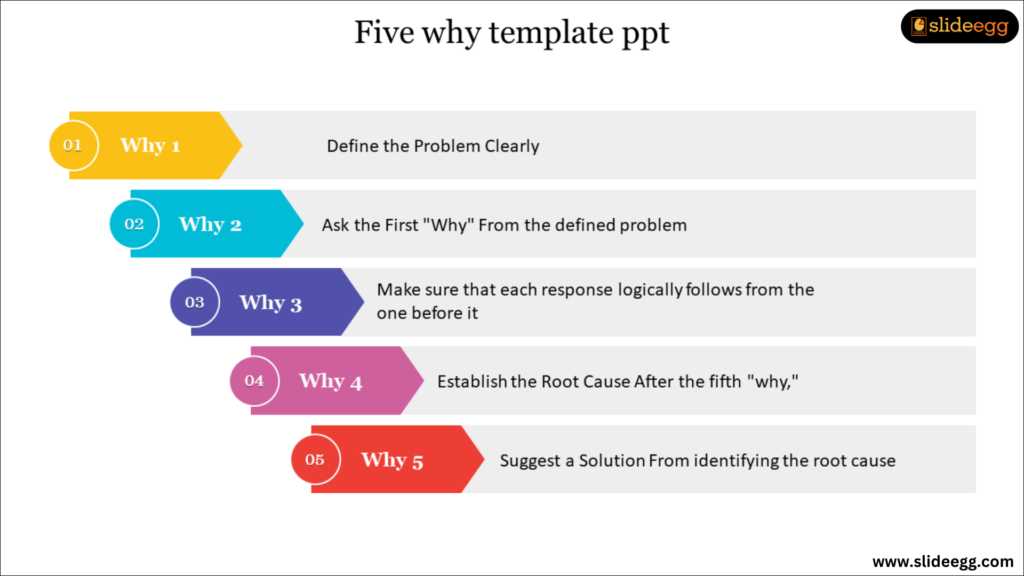
Step 1: Define the Problem Clearly state what the problem is that you are trying to solve. This will be the basis from which you will construct a series of “why” questions. The problem should be highlighted in your infographic.
Step 2: Ask the First “Why” From the defined problem, you will ask the first “why.” You will place that in the first step, or node, of the infographic to illustrate where one would start the questioning.
Step 3: For each subsequent “why,” repeat the process of making sure that each response logically follows from the one before it. You will visualize each “why” as a separate section using a 3D infographic to help your audience visually track the progression.
Step 4: Establish the Root Cause After the fifth “why,” the root cause should now be apparent. This you will need to highlight in your infographic, and it should be the last result of the question-proposing process, using a different colour or shape so it ought to draw attention.
Step 5: Suggest a Solution From identifying the root cause, you will go ahead and provide a solution on your infographic. It connects the dots for a constructive way of solving the problem.
5 Whys Analysis Designing Tips
The ideal infographic should be both informative and eye-catching. Here are some design tips to make an engaging 5 Why Infographic:
Use Color Wisely: Employ different colours for each “why” so the progress will be easy to trace. Multicoloured designs help identify every step to make your infographic dynamic visually.
Node-based layouts: It would work best in showcasing each step of the questioning process. Nodes or steps to represent the process would be clear and easy to follow.
Icons and graphics: It can show up in the form of icons or small illustrations showing what the problem is and each answer to “why”. Visual things tend to be more attractive to the viewer of an infographic.
Keep it Short: Do not make your infographic too wordy. Bulleted lists or short sentences can be used to convey the main whys for each of the “whys.”
Where to Use 5 Why Analysis Template PPT
5 Whys Infographics can be used in a variety of settings including, but not limited to:
Business Presentations: In explaining operational issues or looking to troubleshoot the root cause, the 5 Whys will deliver a system of inefficiency or point of congestion within the process.
Problem Education and Training: The approach shall make students critically think through a problem to identify deeper causes.
Team Discussions: Engage your team in problem-solving workshops using an infographic to guide them through a 5 Why analysis.
Conclusion
Infographics stand out as a great medium for problem-solving presentations because they illustrate how the uncovering of root causes is clearly and engagingly presented in an easy-to-follow manner. You visually map each “why” to help the audience understand the logic involved in this problem-solving technique and come to more effective solutions.
Step into the next presentation and seamlessly weave in these infographics, which automatically make the process of handling complex problems much easier to tackle. When combined with structured visuals and a no-nonsense approach, you will find it far easier to present the 5 Whys with clarity and impact.