
A Venn diagram can be described as one of the best ways in which different sets of data interrelate with their similarities and differences. It is really great for school or work, or any other presentation where you need to break down something clearly and visually. Making them in PowerPoint is pretty easy. Let us show you in this tutorial how to make a Venn Diagram in PowerPoint in just a few simple steps.
Step 1: Launching PowerPoint and Opening a New Slide
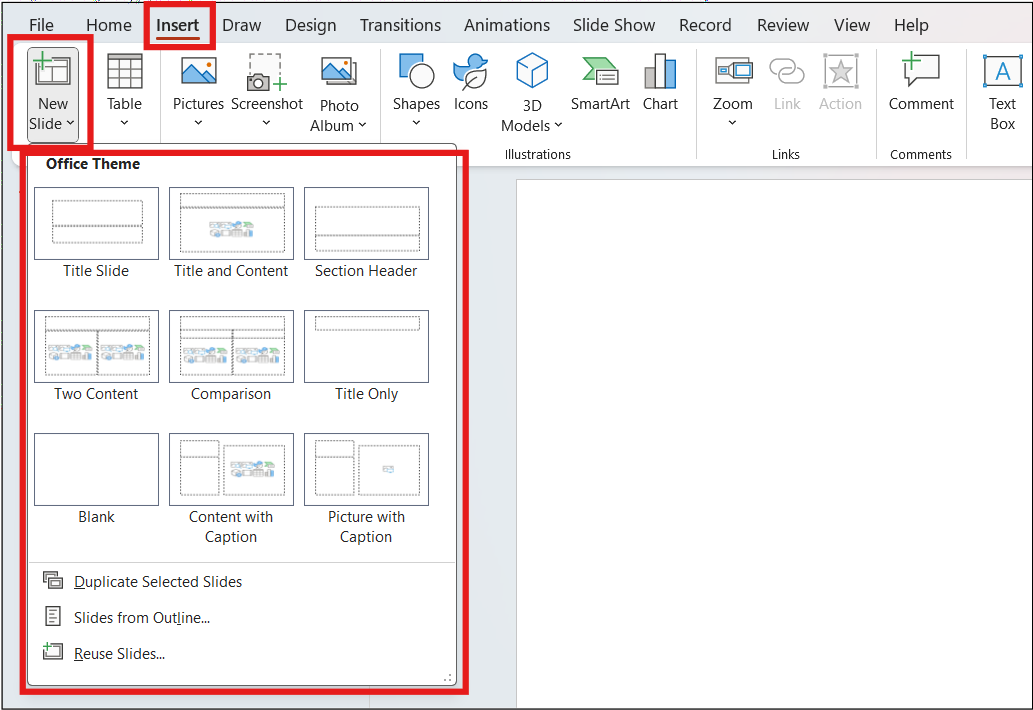
Go ahead and open your PowerPoint presentation or just start a new one. Now, choose the slide where you want to insert your Venn diagram. If you are starting from scratch, click on Insert > New Slide to get a blank slide.
Step 2: Insert a SmartArt Graphic
SmartArt is the fastest way to create a Venn diagram in PowerPoint. Here is what to do:
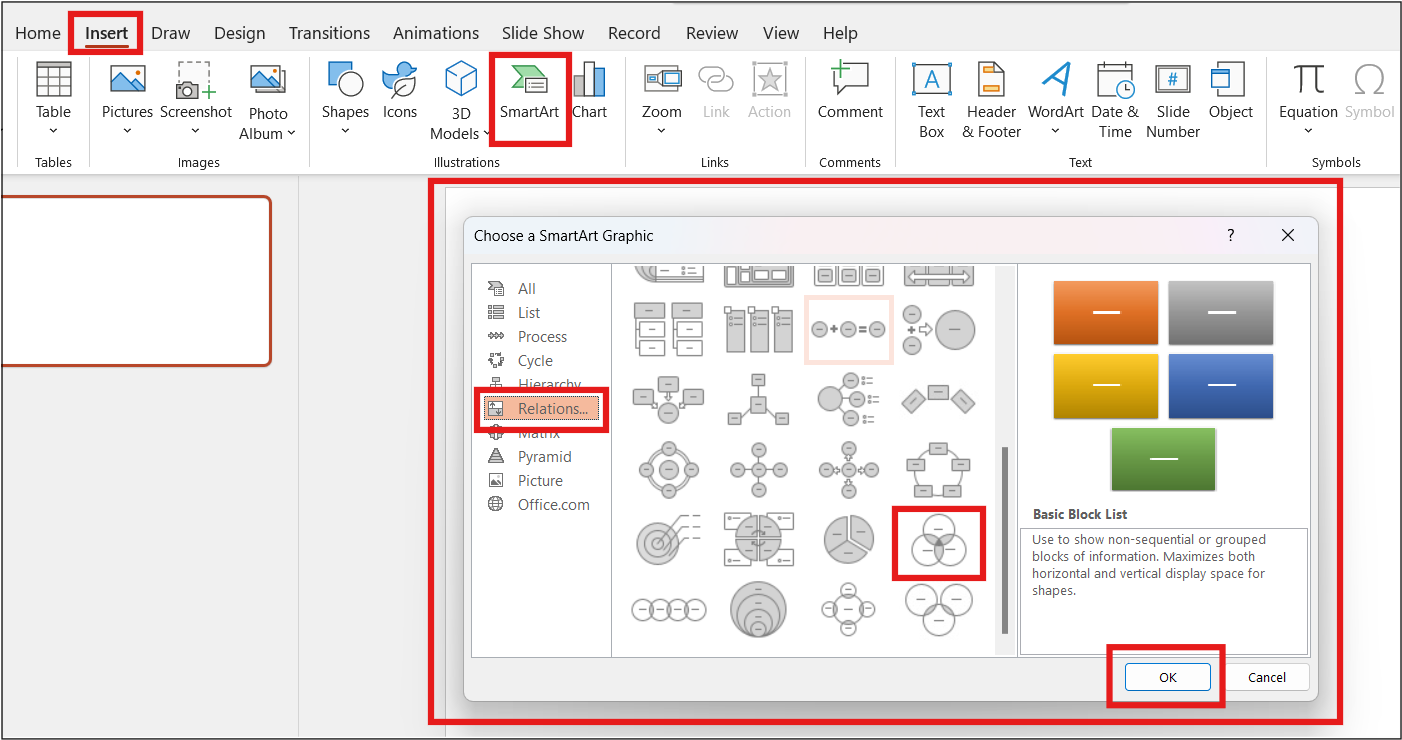
- Click on the Insert Tab.
- Under the drop-down menu, click on SmartArt.
- In the SmartArt Graphic window, scroll down and find the Relationship section.
- Click on the Basic Venn diagram. Click OK.
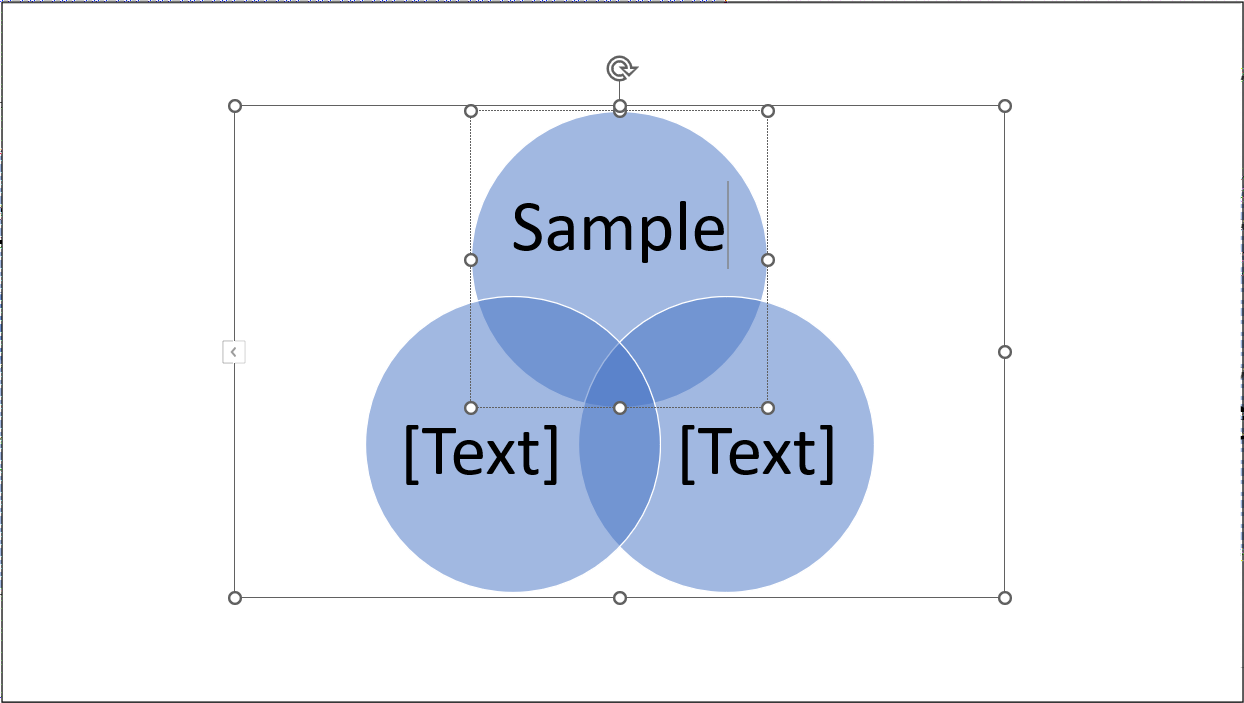
You now have the basic structure of a Venn diagram, which is ready to be customized.
Step 3: Add Text to the Circles
Each circle in the Venn diagram represents one set of your data. You can click in now and add text inside each one of the circles to explain what each circle represents. Just click on the textbox inside each circle and type in your labels.
If you need to add more sets to your Venn chart, click on your diagram first, then go to the SmartArt Design tab and click on Add Shape.
Step 4: Refine the Design of Diagram
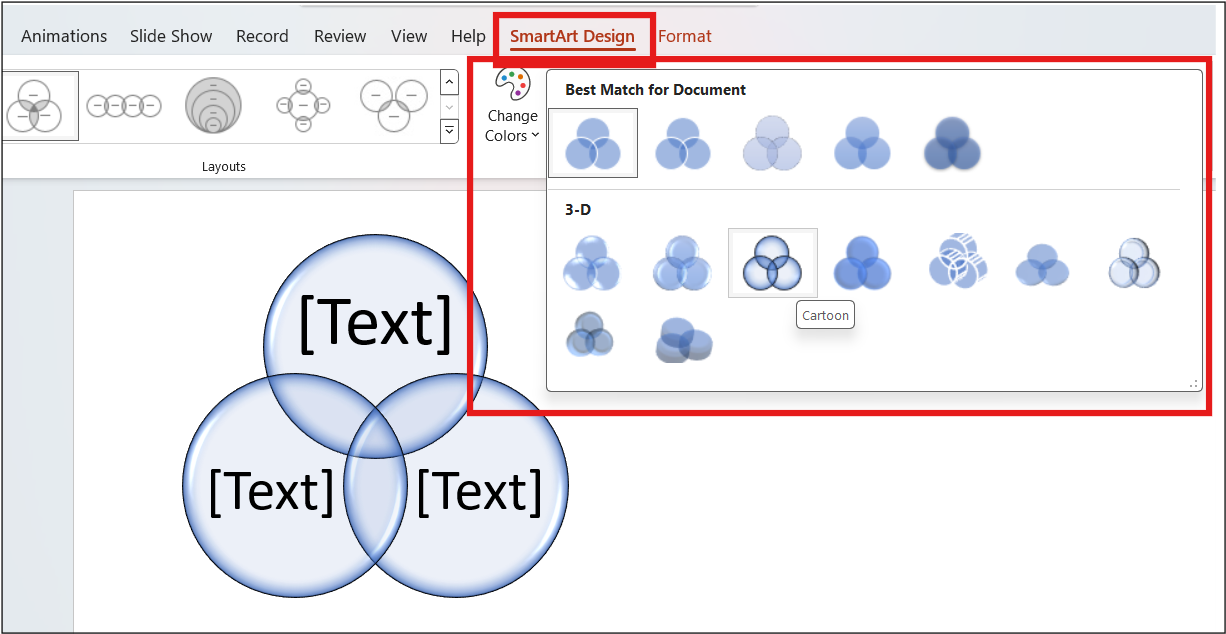
Once you have the text in place, you may customize the Venn diagram to match your presentation theme and style.
- Change Colors: Click the tab SmartArt Design, then Change Colors to find a color combination that will match your slides. Ensure that the colors are in such a way that the parts overlapping are noticeable enough.
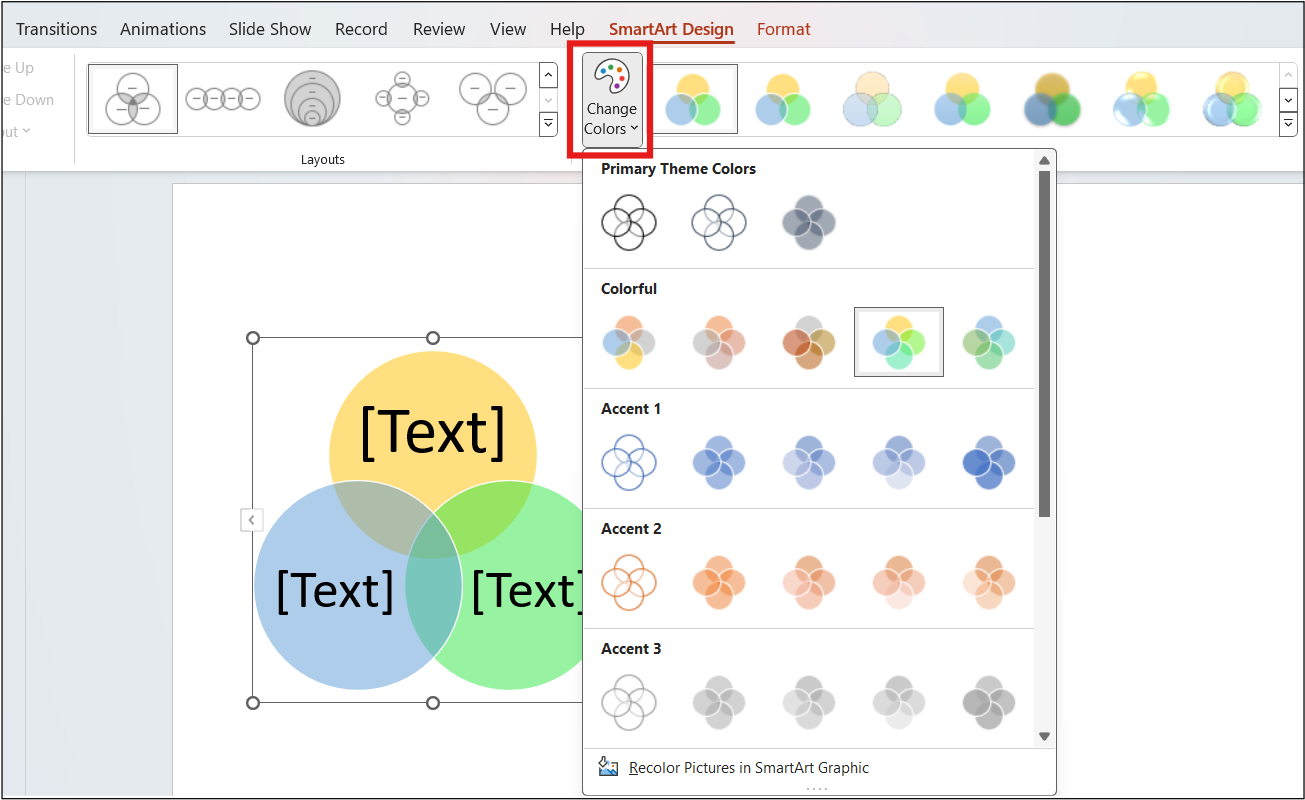
- Resize and Reposition: You can resize circles by dragging and positioning the circles such that the number of overlaps you want to be more or less.
- Add More Circles: An additional circle may also be included if you wish to represent more sets through your Venn diagram.
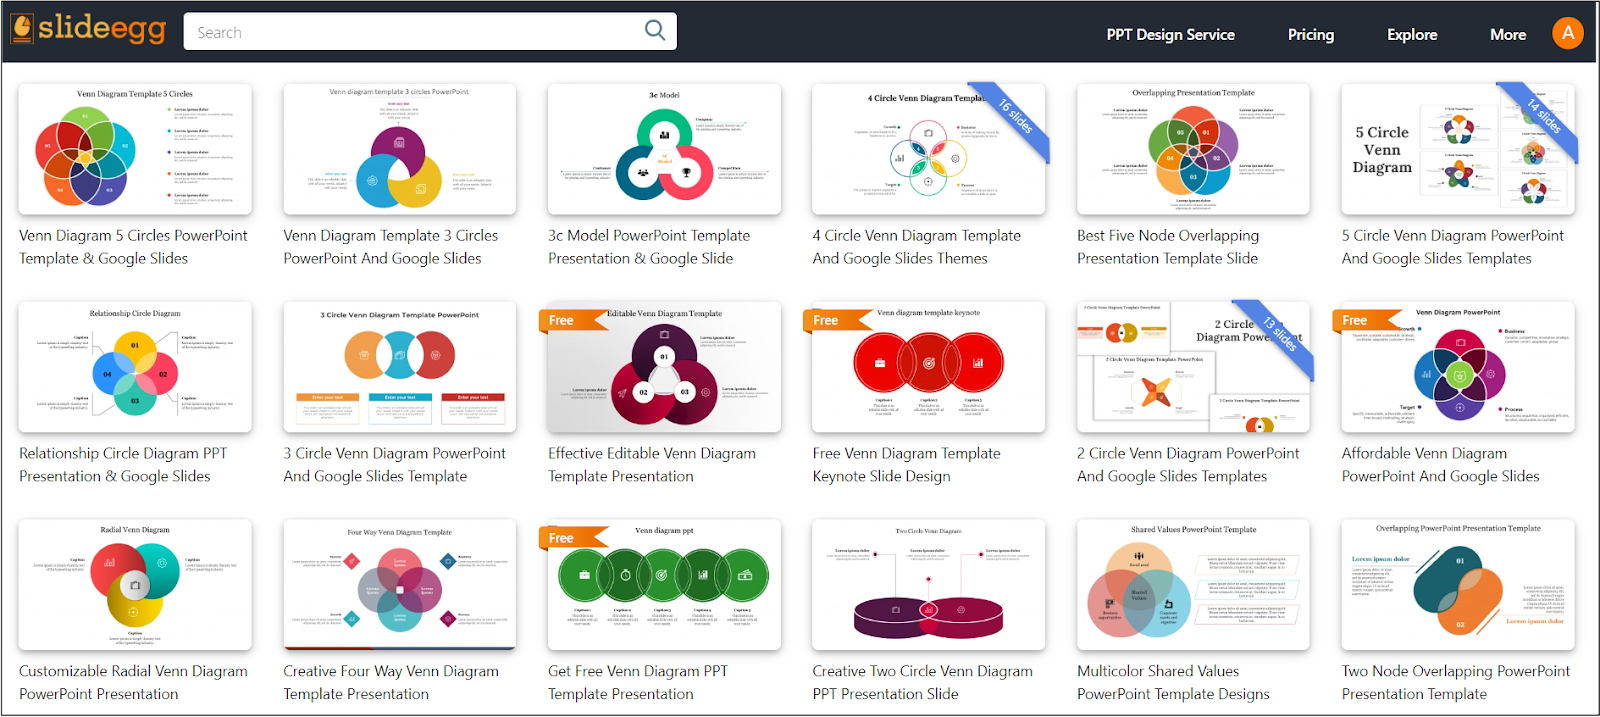
You can also check out Venn diagram presentation templates pre-designed on the Internet. Those templates will save your time and provide you with creative, professionally designed, easy-to-customize designs.
Step 5: Take a Moment to Review
Venn diagrams are great at expressing two complex ideas by simply reducing them to sets of information. Just avoid adding too much information to it; otherwise, it becomes confusing. Keep it simple so that your audience will understand the connections of data sets.
Step 6: Saving and Recording
After making sure your Venn diagram is perfect, do not forget to save the presentation: File > Save As. Let’s loop now all the way through your slide and check that it looks clean and nice. Try running through your presentation. It should show you how your diagram works within your overall presentation.
Conclusion
With little effort, you can easily make a Venn diagram in minutes. From strategies, and product comparisons, to explaining relationships—find some of the intuitive designs of Venn diagrams so one can visualize their ideas effectively.
For other hacks on how to make your presentation better, look up on tips & tricks. If you are working inside Google Slides, it’s probably worth checking out our manual on how to make a Venn diagram in Google Slides. Now you can do your Venn diagram in whatever software you’re in in mere seconds!