Is it easy to navigate a big city without a map? Confusing, right? That’s what it can feel like to work for a company without an organizational chart. An organizational chart (or org chart) is like a map for a company. It shows how the company is structured and the relationships between different roles and departments. Essentially, it’s a visual representation of the company’s hierarchy, showing who reports to whom, who is in charge of what, and how various teams and departments connect.
But How Does It Work?
Think of an org chart as a snapshot of your company’s internal structure. At the top, you’ll usually find the CEO or president. Below them are the senior executives, managers, and so on, cascading down to entry-level employees. Each box on the chart represents a person or a role, and the lines connecting them illustrate reporting relationships and lines of communication.
Why Do Companies Use Organizational Charts?
Companies use org charts for several important reasons. Firstly, they provide clarity. When everyone knows their role and who they report to, it reduces confusion and enhances efficiency. Org charts also help new employees understand the company structure quickly, making onboarding smoother. Furthermore, these charts are valuable tools for planning and strategy. By looking at an org chart, leaders can identify gaps, redundancies, and areas for growth.
What Are the Different Types of Organizational Charts?
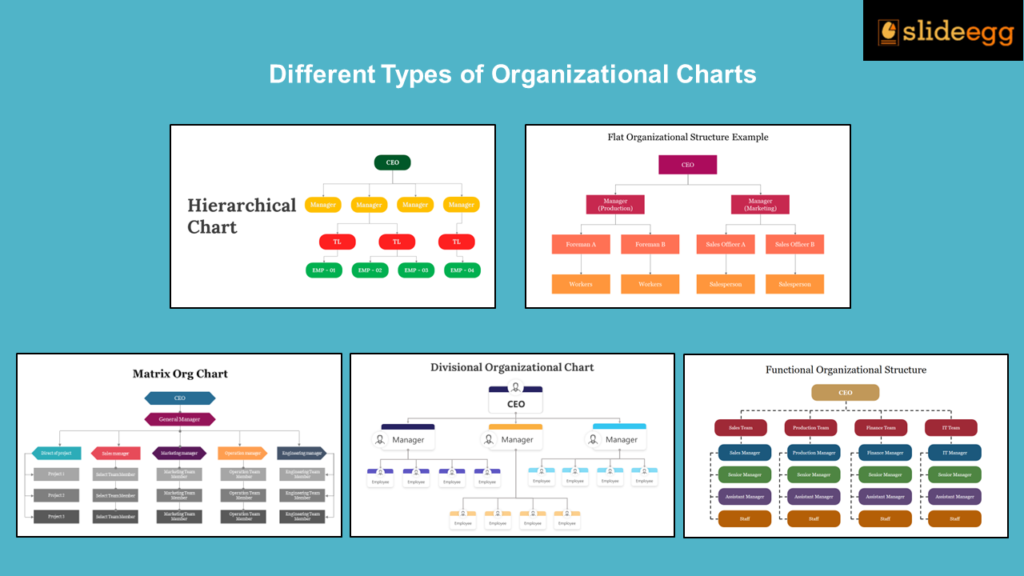
Not all org charts are created equal. There are various types, each serving a specific purpose:
- Hierarchical Chart: This is the most common type, showing a traditional top-down structure.
- Matrix Chart: In a matrix chart, employees report to multiple managers for different projects or functions.
- Flat Chart: A flat chart features few or no levels of middle management between staff and executives, promoting a more open and collaborative environment.
- Divisional Chart: This type organizes departments based on products, services, or geographical locations.
- Functional Chart: It groups employees based on their functions or roles within the company, like marketing, finance, or sales.
How Can an Organizational Chart Improve Business Efficiency?
An organizational chart can be a powerful tool for improving business efficiency. It streamlines communication by clearly showing who is responsible for what. This reduces the likelihood of tasks falling through the cracks or being duplicated. Additionally, it aids in decision-making by delineating authority and responsibility, making it easier to hold the right people accountable. By clearly defining roles, an org chart also helps in workload distribution, ensuring that no employee is overburdened while others are underutilized.
What Should Be Included in an Organizational Chart?
An effective org chart should include:
- Names and Titles: Clearly label each position with the employee’s name and job title.
- Departments and Teams: Show how different departments and teams are structured.
- Reporting Lines: Illustrate the lines of authority and communication between roles.
- Contact Information: Sometimes, including contact details can be helpful, especially in large organizations.
How Do You Create an Effective Organizational Chart?
Creating an effective org chart involves a few key steps:
- Gather Information: Collect all necessary data about employees and their roles.
- Choose the Type of Chart: Decide which type of chart best fits your company’s structure.
- Use Software Tools: Leverage org chart software or templates to design your chart. Tools like Microsoft Visio, Lucidchart, or even simple tools like PowerPoint can be very effective.
- Keep It Updated: Ensure the chart is regularly updated to reflect any changes in the organization.
What Are the Benefits of Using Org Charts?
The benefits of an org chart extend beyond just understanding who’s who in the company:
- Improved Communication: Clear communication lines can be established.
- Enhanced Efficiency: Clarifies roles and responsibilities, reducing overlap and confusion.
- Better Planning: Helps in workforce planning and identifying staffing needs.
- Team Management: Makes it easier to manage teams and understand the flow of information.
How Do Organizational Charts Help in Managing Teams?
Org charts play a crucial role in managing teams by:
- Clarifying Roles: Ensuring everyone knows their responsibilities.
- Enhancing Accountability: Making it clear who is accountable for what.
- Facilitating Coordination: Helping managers coordinate activities and resources more effectively.
What Are the Best Practices for Designing an Organizational Chart?
To design an effective org chart, follow these best practices:
- Keep It Simple: Avoid clutter. Keep the design clean and straightforward.
- Be Consistent: Use consistent shapes, colors, and fonts.
- Update Regularly: Ensure the chart is always up-to-date.
- Use Templates: Professional PowerPoint templates available online can save time and ensure consistency.
What Are Some Innovative Ways to Use Organizational Charts?
Beyond their traditional use, org charts can be used innovatively in various ways:
- Skill Mapping: Highlighting the skills and expertise of employees.
- Project Management: Showing project teams and their reporting lines.
- Strategic Planning: Visualizing future organizational changes or growth.
Communicating the Org Chart Through Presentations
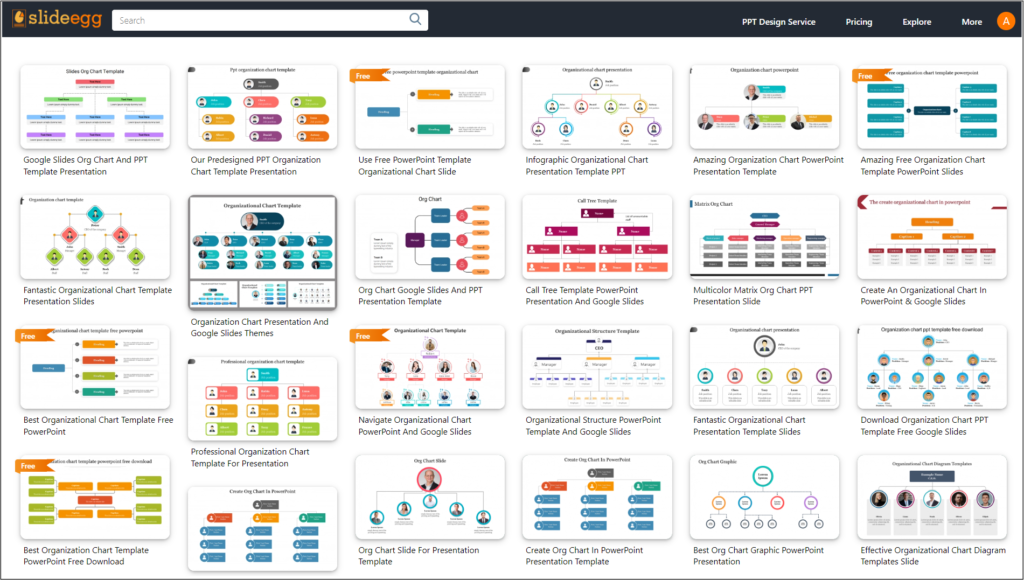
An organizational chart is not just a static document. Presenting it effectively during meetings or onboarding sessions can help communicate its value. Using visual aids and storytelling techniques can make the chart more engaging and easier to understand. Pre-made organizational chart templates can be a lifesaver. They provide a solid foundation, saving time and ensuring consistency. Templates also help maintain a professional look and feel, which is especially useful for presentations and official documents.
Let’s Windup
An organizational chart offers much more than just a basic illustration. It’s a powerful tool that can enhance clarity, improve efficiency, and support strategic planning. By understanding its components and best practices, companies can use org charts to foster better communication and stronger team management. Whether you’re a startup or a large corporation, the right org chart can be a roadmap to your company’s success.