Budget presentations are a crucial part of financial planning and decision-making. Whether it’s analyzing government policies, explaining financial forecasts, or presenting company budgets, a well-structured Budget Presentation helps stakeholders understand complex financial data.
With the release of Budget 2025, businesses, policymakers, and financial analysts must choose the best way to present budget analysis and financial reporting effectively. The two most commonly used tools are PowerPoint and Spreadsheets (Excel, Google Sheets, etc.).
But which one is better? PowerPoint vs. Spreadsheets—which tool offers better data visualization, audience engagement, and storytelling with financial data? This blog will provide a clear comparison of PowerPoint and spreadsheets in presenting Budget 2025’s financial impact and help you choose the right tool for your needs.
Why Budget Presentations Matter
Before diving into the PowerPoint vs. Spreadsheet debate, let’s understand why budget presentations are so important.

1. Simplifies Complex Financial Data
Budget reports contain large amounts of financial data, including revenues, expenses, financial projections, and cost-benefit analysis. Presenting them in an easy-to-understand format ensures decision-makers can quickly grasp key takeaways.
2. Enhances Data-Driven Decision Making
Clear budget analysis helps businesses and policymakers make informed financial decisions. Whether it’s a corporate budget or a national financial plan, proper data presentation ensures strategic planning.
3. Improves Audience Engagement
A dry, number-heavy presentation can lose the audience’s interest. Using the right financial presentation tools ensures the audience remains engaged and absorbs critical financial insights effectively.
PowerPoint vs. Spreadsheet: Which is Better for Budget 2025?
Both PowerPoint and spreadsheets are budgeting software tools, but they serve different purposes. Let’s compare them across key areas.
1. Data Visualization: Making Financial Data Easy to Understand
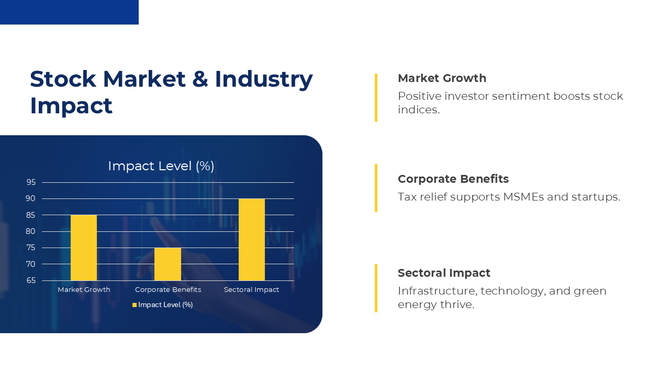
PowerPoint: Offers charts, graphs, infographics, and animations that make budget data visually appealing. With smart data visualization tools, PowerPoint helps present financial trends effectively.
Spreadsheet: Provides in-depth financial data analysis with detailed tables and formulas. However, raw numbers in spreadsheets can be overwhelming for non-financial audiences.
✅ Winner: PowerPoint for visual clarity.
2. Data Presentation: Tables vs. Storytelling with Data
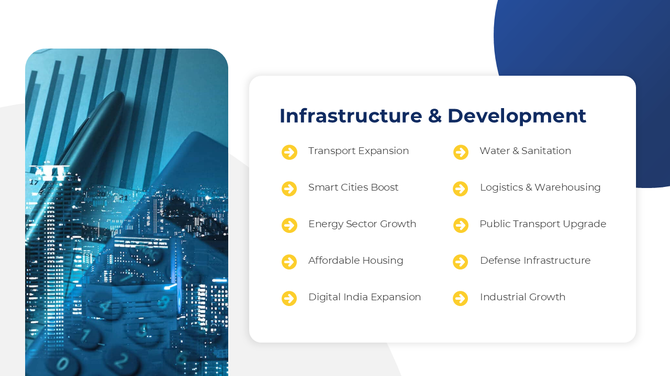
PowerPoint: Allows presenters to structure budget insights into a storytelling format, using slides to highlight key takeaways from Budget 2025.
Spreadsheet: Spreadsheets are excellent for calculations, but presenting raw numbers without visual context can be difficult for audiences to interpret.
✅ Winner: PowerPoint for storytelling with data and structured flow.
3. Audience Engagement: Keeping Stakeholders Interested
PowerPoint: Uses animations, transitions, and multimedia elements to keep presentations engaging. Interactive features like clickable elements and dynamic charts enhance engagement.
Spreadsheet: Lacks engagement features. While it offers accurate budget projections and financial models, spreadsheets can be monotonous for presentations.
✅ Winner: PowerPoint for audience engagement and interactive elements.
4. Financial Projections & Data Accuracy
PowerPoint: While PowerPoint allows data visualization, it doesn’t perform real-time calculations or data modeling. Users must manually update financial data.
Spreadsheet: Spreadsheets excel at budgeting techniques, cost-benefit analysis, and financial projections. They handle dynamic data changes and allow users to create financial models with automated calculations.
✅ Winner: Spreadsheets for financial accuracy and real-time data calculations.
5. Collaboration & Accessibility
PowerPoint: Works best for meetings, reports, and executive summaries. However, updating live financial data in PowerPoint requires importing charts or manually adjusting figures.
Spreadsheet: Spreadsheets like Google Sheets and Excel Online allow real-time collaboration, making it easier for teams to update and analyze financial reports together.
✅ Winner: Spreadsheets for collaboration & real-time data updates.
6. Professional & Corporate Use
PowerPoint: Used for boardroom meetings, investor presentations, and stakeholder reports. Helps executives and decision-makers grasp financial strategies quickly.
Spreadsheet: Best for finance teams, accountants, and analysts who require in-depth calculations and structured data storage.
✅ Winner: PowerPoint for high-level presentations, Spreadsheets for detailed financial reports.
7. Best Use Cases: When to Use PowerPoint vs. Spreadsheet
| Use Case | PowerPoint | Spreadsheet |
| Presenting Budget 2025 Highlights | ✅ Best choice for summarizing budget impact | ❌ Too much raw data for presentations |
| Analyzing Financial Data | ❌ Lacks real-time calculations | ✅ Best for detailed financial analysis |
| Creating Visual Reports | ✅ Infographics, charts & animations | ❌ Tables and raw numbers only |
| Business & Investor Presentations | ✅ Engaging & easy-to-read slides | ❌ Difficult to interpret without explanation |
| Budget Forecasting & Projections | ❌ Limited data processing | ✅ Best for financial modeling |
| Real-Time Data Updates | ❌ Manual updates needed | ✅ Automatically updates formulas & calculations |
Final Verdict: Which Tool is Best for Presenting Budget 2025?
PowerPoint is best for presenting Budget 2025’s impact in a structured, engaging, and visual format. It simplifies complex financial data, improves audience engagement, and helps tell a compelling financial story. With continuous updates and new features, PowerPoint 2025 further enhances its capabilities, making it a strong choice for presentations.”
Spreadsheets are best for in-depth budget analysis, financial modeling, and real-time data calculations. They are essential for internal budget planning but not ideal for presentations.
PowerPoint + Spreadsheet: The Best Approach for Budget 2025
The best strategy is to use both tools together:
✅ Use spreadsheets to analyze, calculate, and model financial data.
✅ Export important charts & insights to PowerPoint for effective presentations.
✅ Combine data-driven decision-making with visual storytelling to engage audiences.
Conclusion: The Future of Budget Presentations
With the rise of data visualization tools and financial presentation software, PowerPoint is becoming an even stronger tool for budget presentations. By integrating live charts, AI-driven insights, and interactive features, PowerPoint helps make Budget 2025’s financial impact more understandable for businesses, policymakers, and the general public.
Looking for professional PowerPoint templates for budget presentations? Check out financial PowerPoint templates to create stunning, data-driven presentations!