
Charts are a fantastic way to showcase data in a visually appealing and informative way. But sometimes, the classic bar or pie chart just doesn’t cut it. One powerful way to do this is by using radial charts. Radial charts are an excellent way to present complex data clearly and attractively. In this guide, we’ll walk you through the process of creating a radial chart in Google Slides and enhancing your presentation with professional design tips.
What is a Radial Chart?
A radial chart, also known as a circular or polar chart, displays data in a circular format, with each data point radiating from a central point. This type of chart is particularly useful for showing multivariate data or illustrating the proportion of categories.
Why Use Radial Charts?
Radial charts offer several benefits:
- Clear Visualization: They make it easy to compare multiple categories.
- Space Efficiency: Radial charts use space efficiently, fitting well in various slide layouts.
- Aesthetic Appeal: Their unique circular design can make your data presentation stand out.
How to Make a Radial Chart in Google Slides
Step 1: Open Google Slides
- Open your Google Drive.
- Click on the “New” button.
- Select “Google Slides” to open a new presentation.
Step 2: Insert a New Slide
- Click on the “+” button in the toolbar to add a new slide.
- Choose a blank slide layout for more flexibility.
Step 3: Use a Premade Template (Optional)
- To save time and ensure your presentation looks professional, consider using premade chart templates available online. These templates often include various charts, including radial charts.
Step 4: Draw the Radial Chart Manually
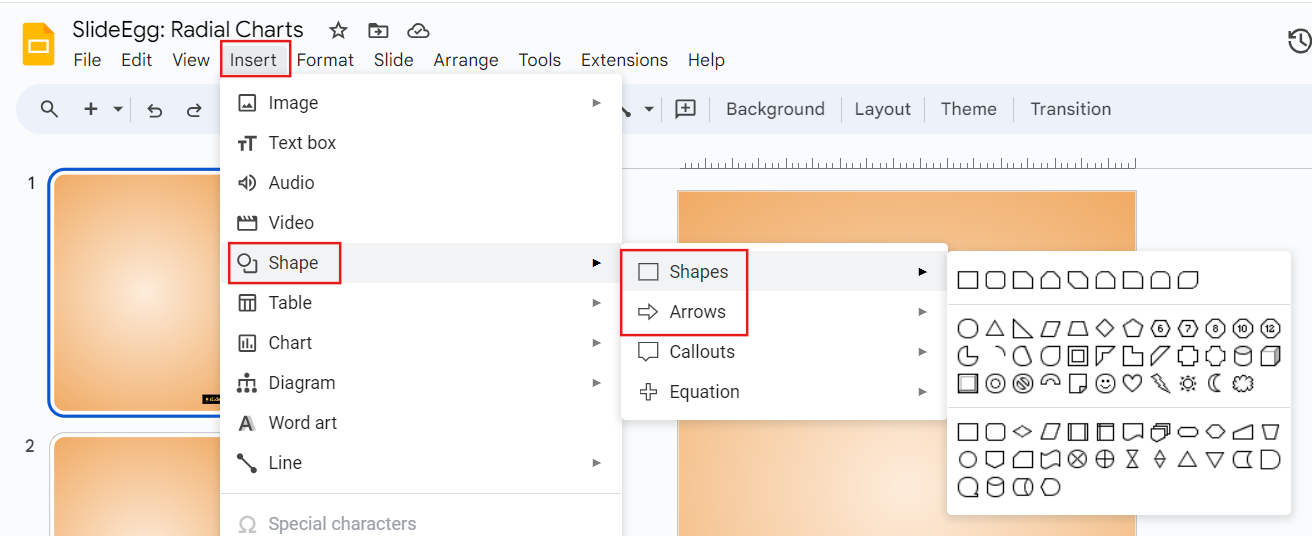
- Go to the “Insert” menu.
- Select “Shape” and choose the circle shape.
- Draw a circle in the center of the slide.
- Insert additional shapes (e.g., lines, smaller circles) to create the radial segments.
Step 5: Add Data
- Click on the radial chart to select it.
- Right-click and choose “Edit Data” to enter your data points.
- Customize the segments to represent your data accurately.
Step 6: Customize Your Chart
- Use the “Format” options to change colors, add labels, and adjust the size of your chart.
- Ensure each segment is clearly labeled for easy understanding.
Tips and Tricks for Better Radial Charts
- Consistency: Maintain consistent colors and sizes for clarity.
- Simplicity: Avoid cluttering your chart with too much data.
- Highlight Key Points: Use contrasting colors to highlight important segments.
For more advanced tips and tricks, check out our tips & tricks page to learn more presentation hacks that can elevate your slides.
Using External Data
If you have data in Excel or Google Sheets, you can import it into Google Slides to create your radial chart. This method ensures accuracy and saves time on data entry.
Step 1: Prepare Your Data
- Open your Google Sheets or Excel file.
- Format your data in a way that can be easily copied (e.g., columns for labels and values).
Step 2: Insert Chart
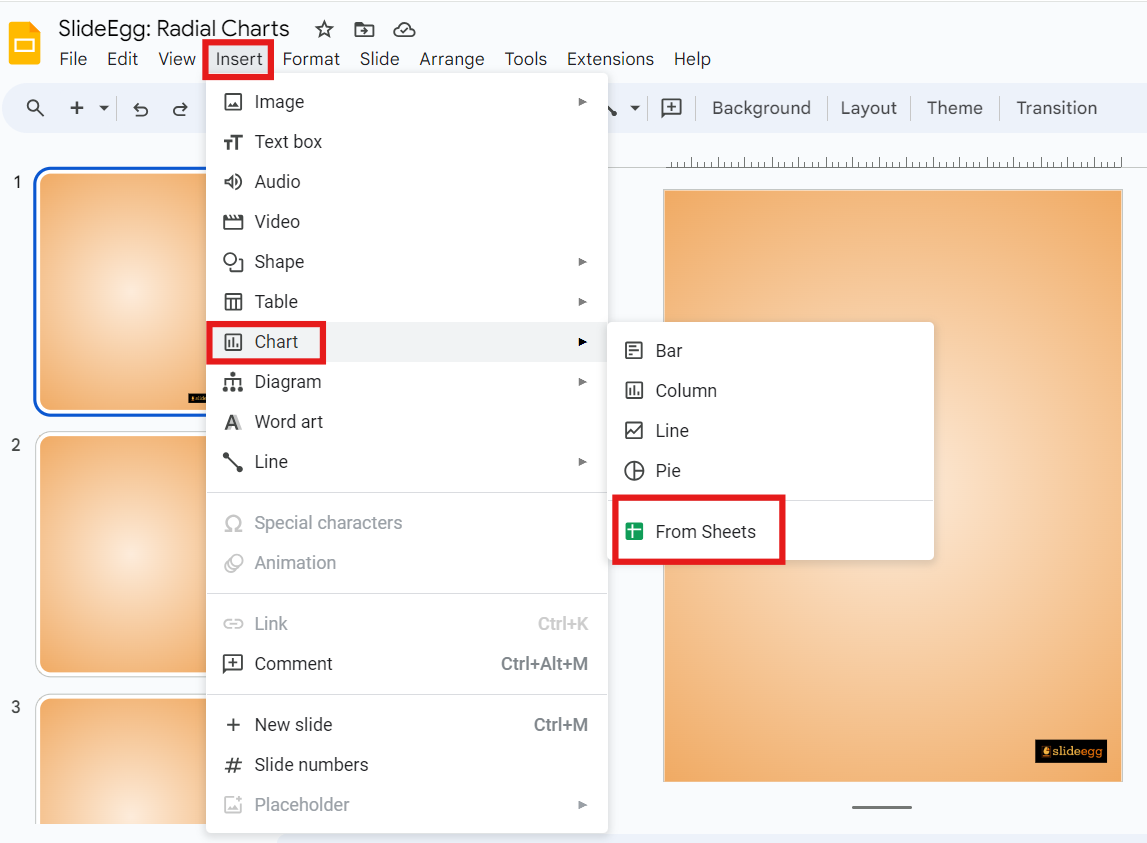
- In Google Slides, navigate to the “Insert” menu.
- Select “Chart” and then “From Sheets.”
- Choose your data file and select the appropriate range.
Step 3: Customize
- Click on the inserted chart.
- Use the “Chart Editor” to switch to a radial format and customize it.
Enhancing Your Presentation
Step 1: Choose a Theme
- Select a theme that complements your data. Free Google Slides themes can be a great starting point, offering a variety of professional designs.
Step 2: Add Transitions and Animations
- Use subtle transitions to keep your audience engaged.
- Apply animations to the radial chart to reveal data points dynamically.
Step 3: Review and Revise
- Ensure all data is accurate.
- Double-check labels and legends.
- Preview your presentation to make sure it flows well.
Conclusion
Creating a radial chart in Google Slides is an easy process. By following this guide, you can create clear, compelling visualizations that help convey your data effectively. If you’re using PowerPoint, refer to our guide on how to make a radial chart in PowerPoint for a detailed walkthrough. Start designing!