Best Charts PowerPoint Presentation Template

Bar chart showing company annual growth from 2014 to 2019, with blue bars representing target values.
P.ID : 32035
    170 views
    6 Downloads
    Get Custom Slides by Experts
    Instantly Access Templates in PowerPoint

     Best Charts Presentation Template


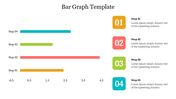
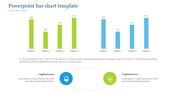
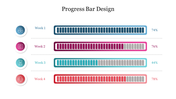
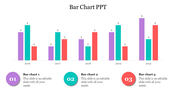
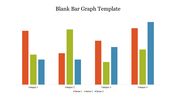
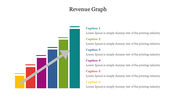
    Introducing our Best Charts PowerPoint Template. This easy-to-use template includes a variety of pre-designed charts, including bar charts, line charts, pie charts, and more. Each chart is professionally designed and customizable, so you can easily tailor them to your specific data. With this template, you can create stunning presentations that will help you capture your audience's attention and leave a lasting impression. It features a bar chart labeled “Company Annual Growth” spanning the years from 2014 to 2019. The x-axis represents the years, while the y-axis indicates the growth percentage.

    Who can benefit from this template?

    1. Professionals of all industries who need to create presentations for clients, colleagues, or investors
    2. Educators want to create engaging presentations for their students
    3. Students who need to create presentations for class projects or reports


    Why use this template?

    Save time and effort by using pre-designed charts
    Communicate your data clearly and effectively

    Features of the template:

    •  Slides are available in 4:3 & 16:9
    • Well-crafted template with instant download.
    • Get slides that are 100% customizable and easy to download
    Advertisement

    You May Also Like These PowerPoint Templates

    Add to Wishlist
    Download
    AI Customize
    Horizontal bar graph slide with four color coded categories in green, yellow, red, and purple, with text descriptions.
    Add to Wishlist
    Download
    AI Customize
    A slide with a comparison chart featuring two designs, each with steps and bar graphs in orange, red, blue, green and purple.
    Free
    Add to Wishlist
    Download
    AI Customize
    Top Notch Comparison Bar Graph PowerPoint Presentation
    Add to Wishlist
    Download
    AI Customize
    A slide displaying a sample bar chart with monthly data from may to december, featuring colorful bars and descriptive text.
    Add to Wishlist
    Download
    AI Customize
    Horizontal chart with four colored bars, each with a color coded icon and caption on the left.
    Add to Wishlist
    Download
    AI Customize
    Bar chart in four distinct bars in multi colour each showing data points with corresponding labels, values and caption areas.
    Add to Wishlist
    Download
    AI Customize
    Chart PowerPoint slide with bar graph and four icons representing data, calendar, and people with placeholder text.
    Add to Wishlist
    Download
    AI Customize
    Colorful bar graph illustrating monthly data with values for each month from january to december.
    Add to Wishlist
    Download
    AI Customize
    Slide with a businessman holding a megaphone projecting speech bubble displaying communication icons, and bar charts below.
    Add to Wishlist
    Download
    AI Customize
    Creative graph slide with colorful numbered captions and a bar chart displaying varying percentage values from 40% to 80%.
    Free
    Add to Wishlist
    Download
    AI Customize
    Three separate bar charts in red tones, each section labeled with a percentage and caption.
    Add to Wishlist
    Download
    AI Customize
    A slide featuring four bar graphs labeled A, B, C, and D with caption areas underneath, connected by dotted arrows.
    Add to Wishlist
    Download
    AI Customize
    Three charts with orange bars displayed against dark backgrounds, each labeled with categories and series.
    Add to Wishlist
    Download
    AI Customize
    Progress bar template showing Process A and B side by side, with four stages and completion percentages.
    Add to Wishlist
    Download
    AI Customize
    Presentation slide featuring multicolored bar graphs for categories and a purple and gray pie chart with text sections below.
    Add to Wishlist
    Download
    AI Customize
    Bar chart with two sections in orange and green, with captions and numerical values under each.