Market growth BCG matrix PowerPoint presentation Slide

Business strategy BCG matrix chart with a 3D effect, categorizing products based on relative market share and market growth.
P.ID : 34569
    152 views
    6 Downloads
    Get Custom Slides by Experts
    Instantly Access Templates in PowerPoint

    Best Market Growth BCG Matrix PowerPoint Template For Presentation


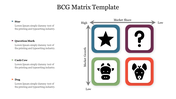
    BCG Matrix - Boston Consulting Matrix
    Download the new impressive BCG matrix power point presentation slide to determine the strategic position of a product or the brand. This helps to analyze business units, that is, their product lines. It is called a business planning tool that helps in bringing out the position of a brand portfolio. This template has multiple edit options that help to add various data in a perfect manner.
    This template has a 3D design that looks cool, and this helps determine the market growth with market share. You can place your texts in the blue space available in this template. For more templates, visit the category page and explore plenty of categories.

    Features of this template:


    • 100 % customizable slides and easy to download.
    • Slides available in different nodes & colors.
    • The slide contained in 16:9 and 4:3 format.
    • Easy to change the slide colors quickly.
    • Well-crafted template with instant download facility.
    • The clear layout of this template will help you to design a professional-looking presentation.
    • The multi-color visuals of this slide will make your presentation eye-catching.

    Advertisement

    You May Also Like These PowerPoint Templates

    Add to Wishlist
    Download
    AI Customize
    Hoshin Kanri Planning Matrix PPT Template & Google Slides
    Add to Wishlist
    Download
    AI Customize
    Escalation matrix slide with a blue staircase-like design with numbered levels labeled A to E, with placeholder area.
    Add to Wishlist
    Download
    AI Customize
    Mekko chart displaying six topics with varied widths and heights to represent proportional data in a stacked bar format.
    Add to Wishlist
    Download
    AI Customize
    BCG Matrix Examples Companies Presentation PPT
    Add to Wishlist
    Download
    AI Customize
    Myers Briggs grid with purple, green, blue, and orange sections, divided by personal and logical traits.
    Add to Wishlist
    Download
    AI Customize
    3x3 matrix showing potential versus performance, with red, teal, and orange squares representing various categories.
    Add to Wishlist
    Download
    AI Customize
    Pricing strategy matrix slide displays four colored quadrants based on price and quality.
    Add to Wishlist
    Download
    AI Customize
    Escalation matrix slide showing roles from a support ticket to the manager with corresponding icons and hexagonal shapes.
    Add to Wishlist
    Download
    AI Customize
    Quad Chart PPT Presentation and Google Slides Themes
    Add to Wishlist
    Download
    AI Customize
    Four red shaded boxes in a vertical flowchart with arrows between them, showing an escalation process from top to bottom.
    Add to Wishlist
    Download
    AI Customize
    3x3 grid of circles in different colors, forming a matrix layout with axes, with a text area on the right.
    Add to Wishlist
    Download
    AI Customize
    Matrix layout of four colored squares in purple, red, green, and blue, with gray header and sidebar, each with text.
    Add to Wishlist
    Download
    AI Customize
    A grid-style SPACE matrix chart with four labeled quadrants in orange, blue, red, and green each with caption areas.
    Add to Wishlist
    Download
    AI Customize
    Best Ansoff Matrix PowerPoint And Google Slides Templates
    Add to Wishlist
    Download
    AI Customize
    Innovation Ambition PowerPoint Matrix and Google Slides
    Add to Wishlist
    Download
    AI Customize
    Eisenhower Matrix PowerPoint Template and Google Slides
    Add to Wishlist
    Download
    AI Customize
    9 Box Performance Review Template and Google Slides
    Add to Wishlist
    Download
    AI Customize
    Risk matrix chart with color coded cells indicating risk severity, combining likelihood and consequence levels.