Attractive Bar Chart PPT Template With Red Color theme

 Canva
Canva
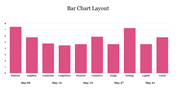
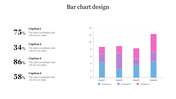
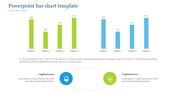

Effective Bar Chart PPT Template
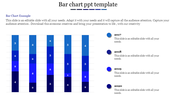
Get our Bar Chart PPT Template to track all yearly plans with a bar chart. Any person can use this template to present their data, focus on new goals, and periodic business reports. You can also use particular slides for many topics. In addition, our Templates have Multicolor options so you can choose your best template. Finally, users can use this template in project meetings or business meetings.
About this template
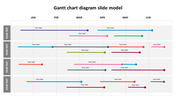
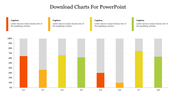
This template has five charts. Each chart has different year data. However, It is a multicolored template with a red color chart. In addition, different shades of red color in the chart add meaning to an overall presentation. Users can add text on the top of the template. We also have a wide range of Chart presentation slides.
Why should you choose us?
- Our templates are 100% customizable and editable, so you don't need to worry about changing the color, font, and text.
- In addition, the red chart layout of the presentation gives a modern look and feel. You can use this to show the flow of your business or marketing plan.
- Our template is unique and straightforward. All Nodes are easy to edit, and you can easily change the color.
Feature of this template
- Fully Customizable (shape color, size & text)
- This template has a Multicolor theme, and you can also choose the color
- Drag and drop image placeholder
- This slide supports 16:9 and 4:3 format.
- Easily readable and acceptable template.
- Easy to change the slide colors quickly.


You May Also Like These PowerPoint Templates
Add to Wishlist
Download
AI Customize

Add to Wishlist
Download
AI Customize

Add to Wishlist
Download
AI Customize

Add to Wishlist
Download
AI Customize

Add to Wishlist
Download
AI Customize

Add to Wishlist
Download
AI Customize

Add to Wishlist
Download
AI Customize

Add to Wishlist
Download
AI Customize


Add to Wishlist
Download
AI Customize

Add to Wishlist
Download
AI Customize

Add to Wishlist
Download
AI Customize

Add to Wishlist
Download
AI Customize

Add to Wishlist
Download
AI Customize

Add to Wishlist
Download
AI Customize

Add to Wishlist
Download
AI Customize

Add to Wishlist
Download
AI Customize

Add to Wishlist
Download
AI Customize

Free
Add to Wishlist
Download
AI Customize

Add to Wishlist
Download
AI Customize
