Get Bar Chart PPT Template and Google Slides Themes


Visualize Data Effectively with the Bar Chart Template
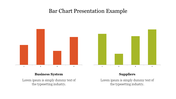
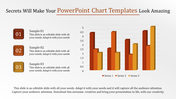
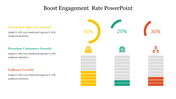
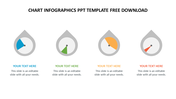
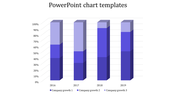
Bar charts are essential for comparing data across different categories, making them invaluable for business, education, and research. The Bar Chart PPT Template and Google Slides Themes feature five yellow-themed bars with four sections. Each section includes a dot, a caption, and a text area, allowing for detailed data representation. This template also offers a multicolor option for enhanced customization.
Ideal for business analysts, educators, and researchers, this template can be used in board meetings, academic presentations, and research seminars to present data clearly and effectively. The structured design ensures that your data is not only informative but also visually engaging.
Utilize the Bar Chart PowerPoint Template to present your data with clarity and impact, making it easier for your audience to understand and engage with the information you are sharing.
Features of the template
- 100% customizable slides are easy to download.
- Slides are available in different colors.
- The slide has 4:3 and 16:9 formats.
- It is easy to change the slide colors quickly.
- It has a cute design to impress an audience.
- Create feature-rich, animated presentations.


You May Also Like These PowerPoint Templates
Free
Add to Wishlist
Download
AI Customize

Free
Add to Wishlist
Download
AI Customize

Add to Wishlist
Download
AI Customize


Add to Wishlist
Download
AI Customize


Add to Wishlist
Download
AI Customize

Add to Wishlist
Download
AI Customize

Add to Wishlist
Download
AI Customize

Add to Wishlist
Download
AI Customize

Add to Wishlist
Download
AI Customize

Add to Wishlist
Download
AI Customize

Add to Wishlist
Download
AI Customize

Add to Wishlist
Download
AI Customize

Add to Wishlist
Download
AI Customize

Add to Wishlist
Download
AI Customize

Add to Wishlist
Download
AI Customize

Add to Wishlist
Download
AI Customize

Add to Wishlist
Download
AI Customize

Add to Wishlist
Download
AI Customize
