Editable Bar chart PPT template and Google slides

Slide with revenue and new customer data, featuring blue and orange bars, on a rounded white sections on a dark background.
P.ID : 17858
    498 views
    13 Downloads
    Get Custom Slides by Experts
    Instantly Access Templates in PowerPoint

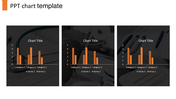
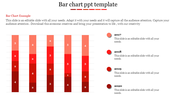
    Captivating Bar chart PPT template presentation


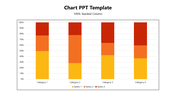
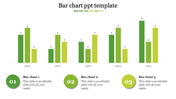
    Struggling to turn data into presentations that don't put your audience to sleep? Bar chart PPT templates are your secret weapon! Ditch the confusing spreadsheets and replace them with clear, colorful bar charts that make your info pop.
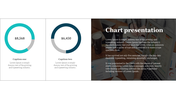
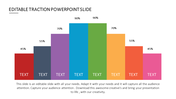
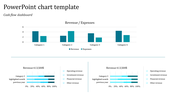
    Imagine using two customizable bar charts to showcase any kind of data, from sales figures to student test scores. Each chart lets you add labels, titles, and details to explain what the bars represent. These templates are perfect for anyone who needs to communicate data clearly,  from teachers in the classroom to business people giving reports.
    Plus, they're a huge time saver! No need to be a chart-making pro. Just swap out the placeholder text with your own information and customize the colors to match your style. Bar chart PPT templates: They'll help you transform your data presentations from dull to dazzling. Download yours today and watch your audience go from confused to "Aha!"

    Features of the template


    • 100% customizable slides and easy to download.
    • The slides contain 16:9 and 4:3 formats.
    • Easy to change the colors quickly.
    • It is a well-crafted template with an instant download facility.
    • It is a 100% pre-designed slide.
    • The slide holds vibrant colors.
    Advertisement

    You May Also Like These PowerPoint Templates

    Add to Wishlist
    Download
    AI Customize
    Chart slide showing market supply data from 2004 to 2014 with red bars and percentage annotations.
    Add to Wishlist
    Download
    AI Customize
    Dashboard with four bar charts in yellow, green, teal, and red, comparing project risks and change requests.
    Add to Wishlist
    Download
    AI Customize
    Comparison slide featuring male and female icons, paired with captions and bar chart below, in blue and green tones.
    Add to Wishlist
    Download
    AI Customize
    Project Gantt chart with task descriptions, percentage completion, and horizontal progress bars.
    Add to Wishlist
    Download
    AI Customize
    Three circular dashboard dials with red, blue, and brown segments, each containing captions below.
    Add to Wishlist
    Download
    AI Customize
    Slide featuring a dashboard with three dials labeled Low, Mid, and High, indicating various levels of measurement.
    Add to Wishlist
    Download
    AI Customize
    Slide with pie charts, line graphs, and a bar chart in shades of green, illustrating data trends and comparisons.
    Add to Wishlist
    Download
    AI Customize
    Six month Gantt chart with bars in blue, green, red, orange, and teal, arranged for task tracking.
    Free
    Add to Wishlist
    Download
    AI Customize
    Infographic of a bar chart representing yearly growth from 2018 to 2021 with a businesswoman illustration.
    Add to Wishlist
    Download
    AI Customize
    Circular pie chart divided into five colored sections noted with percentages, with corresponding boxes for text area.
    Free
    Add to Wishlist
    Download
    AI Customize
    3D bar chart PowerPoint template showcasing data in four colored categories with a highlight and captions.
    Free
    Add to Wishlist
    Download
    AI Customize
    Horizontal chart with dual color bars in green and blue, displaying percentage values, and two captions on the right.
    Add to Wishlist
    Download
    AI Customize
    Slide with a vertical bar chart and four labeled sections, each paired with a unique color and icon.
    Free
    Add to Wishlist
    Download
    AI Customize
    Market research slide showing a line graph with three levels over the years 2016 and 2019, with a caption box.
    Free
    Add to Wishlist
    Download
    AI Customize
    A blue themed slide featuring a multi year bar chart comparison from 2016 to 2021 with three placeholders below.
    Free
    Add to Wishlist
    Download
    AI Customize
    3D chart with five colored bars in gold, red, green, teal, and orange, on individual bases, displaying percentages above.
    Free
    Add to Wishlist
    Download
    AI Customize
    Five step process chart with titled segments in shades of purple, showing stages and supporting information.