Bar Chart PowerPoint Template and Google Slides

 Canva
Canva


Bar Chart PowerPoint Template and Google Slides
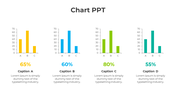
Our Bar Chart PPT Template and Google Slides can be your saving grace! This free template is perfect for anyone who wants to effectively showcase comparisons, trends, or financial performance clearly and concisely.
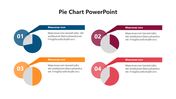
This template features two distinct bar charts, each accompanied by a relevant icon. One bar chart features a piggy bank icon, ideal for representing savings or costs, while the other features a coins icon, perfect for showcasing revenue or profits. You can easily customize the data and descriptions for each bar chart to perfectly represent your unique information. This template is a great fit for marketers comparing campaign performance, entrepreneurs outlining financial projections, or sales teams presenting revenue growth. Anyone who wants to communicate data comparisons and leave a lasting impression can benefit from this template.
Features of this template:
- 100 % customizable slides are easy to download.
- Slides are available in different nodes and colors.
- The slide was contained in 16:9 and 4:3 formats.
- It is easy to change the slide colors quickly.
- Well-crafted template with an instant download facility.
- The clear layout of this template will help you design a professional-looking presentation.
- The multi-color visuals on this slide will make your presentation eye-catching.


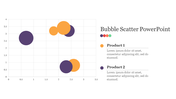
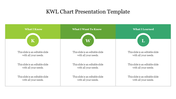
You May Also Like These PowerPoint Templates
Add to Wishlist
Download
AI Customize

Add to Wishlist
Download
AI Customize

Add to Wishlist
Download
AI Customize

Add to Wishlist
Download
AI Customize

Add to Wishlist
Download
AI Customize

Add to Wishlist
Download
AI Customize

Add to Wishlist
Download
AI Customize

Add to Wishlist
Download
AI Customize

Add to Wishlist
Download
AI Customize

Add to Wishlist
Download
AI Customize

Add to Wishlist
Download
AI Customize


Add to Wishlist
Download
AI Customize

Add to Wishlist
Download
AI Customize

Add to Wishlist
Download
AI Customize

Add to Wishlist
Download
AI Customize

Add to Wishlist
Download
AI Customize

Add to Wishlist
Download
AI Customize

Add to Wishlist
Download
AI Customize

Add to Wishlist
Download
AI Customize
