Simple Bar Chart PPT Template and Google Slides Themes

A PPT slide featuring a grayscale bar chart with data for the years 2016 through 2021, with labeled sections for each year.
P.ID : 25981
    191 views
    7 Downloads
    Get Custom Slides by Experts
    Instantly Access Templates in PowerPoint

    Transform Data with the Bar Chart Template 


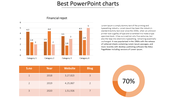
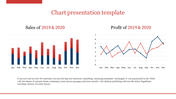
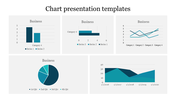
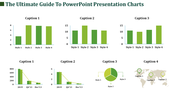
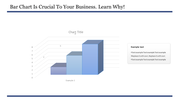
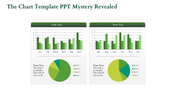
    Bar charts are powerful tools for comparing data across different categories. They help viewers grasp complex information quickly by displaying data in a visual format. The Bar Chart PPT Template and Google Slides Themes offer grey-themed bar charts paired with three dots, each accompanied by a caption and a text area. The template also includes a multicolor option for added versatility.

    This template is perfect for data analysts, educators, business professionals, and marketers who need to present data in a clear and impactful way. You can use this slide in business meetings, academic lectures, and marketing presentations to highlight comparisons, trends, and key insights. The clean and professional design ensures your data is easy to understand and visually appealing.

    Enhance your presentations with the Bar Chart PPT Template and Google Slides Themes to effectively communicate your data and engage your audience.

    Features of the template


    • 100% customizable slides are easy to download.
    • Slides are available in different colors.
    • The slide has 4:3 and 16:9 formats.
    • It is easy to change the slide colors quickly.
    • It has a cute design to impress an audience.
    • Create feature-rich, animated presentations.
    Advertisement

    You May Also Like These PowerPoint Templates

    Add to Wishlist
    Download
    AI Customize
    Dashboard with a multi-colored semicircular gauge divided into four sections, labeled 01 to 04, and captions on the right.
    Add to Wishlist
    Download
    AI Customize
    Business analysis dashboard with a bar chart and an illustrated man holding a pointer in a dark background.
    Add to Wishlist
    Download
    AI Customize
    PowerPoint Chart Template And Google Slides-Three Node
    Free
    Add to Wishlist
    Download
    AI Customize
    Four cylindrical blue bars in a row next to a woman in a black suit in a simple design layout.
    Add to Wishlist
    Download
    AI Customize
    Market research dashboard with a segmented horizontal bar chart analyzing brand perception and a donut chart.
    Add to Wishlist
    Download
    AI Customize
    Dashboard slide with a speedometer gauge in red, blue, yellow, and teal, and text bullet points on the left.
    Add to Wishlist
    Download
    AI Customize
    Data analysis slide with four bar charts in red, green, yellow, and orange, surrounding a dark text box in the center.
    Add to Wishlist
    Download
    AI Customize
    Green themed diagram illustrating stages of analysis delivery, from data source to client reports and dashboards.
    Add to Wishlist
    Download
    AI Customize
    A slide showcasing four different chart types from Column Histogram to Scatter Plot with corresponding data.
    Add to Wishlist
    Download
    AI Customize
    Sashboard design featuring three plant species data and corresponding progress meters in red, green, and blue.
    Add to Wishlist
    Download
    AI Customize
    Green circular chart with five segments labeled by categories and percentages, with descriptions around it.
    Add to Wishlist
    Download
    AI Customize
    Chart PPT template showing 4 progress circles with percentages and color coded sections for Blue, Green, Yellow, and Orange.
    Add to Wishlist
    Download
    AI Customize
    Dashboard layout with bar, pie, and stacked charts in yellow, orange, red, and green on a white background.
    Add to Wishlist
    Download
    AI Customize
    Comparison chart with vertical bars on blue and yellow split background, and icons for male and female with captions.
    Free
    Add to Wishlist
    Download
    AI Customize
    An annual sales template with sections labeled Heading 1 to 5 and a pie chart illustrating various percentages with text.
    Add to Wishlist
    Download
    AI Customize
    Infographic featuring pie graph, horizontal and vertical bar charts for visualizing data trends and comparisons.
    Free
    Add to Wishlist
    Download
    AI Customize
    Illustrative slide combining a pie chart with 45% in green and five silhouette icons to convey data distribution.
    Free
    Add to Wishlist
    Download
    AI Customize
    Vertical bar chart with three purple bars increasing from 2019 to 2021, each labeled with percentages, and a businesswoman.