Bar Chart PPT Template and Google Slides Themes

Stacked bar chart in grayscale showing data from 2017 to 2020 with labeled segments and caption areas.
P.ID : 25949
    141 views
    1 Downloads
    Get Custom Slides by Experts
    Instantly Access Templates in PowerPoint

    Bar Chart PPT Template and Google Slides Themes


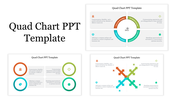
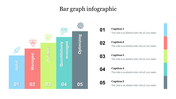
    Enhance your data presentations with our professional bar chart PowerPoint template and Google Slides design. This template features sleek gray bars placed on a graph chart, each bar clearly labeled with levels of measurement and years for precise definition. Ample space is provided for text, allowing you to add detailed explanations and insights alongside your data. 

    Whether you're presenting financial performance, sales figures, or research results, this template ensures your information is communicated clearly and effectively. Make your data stand out and drive your message home with this clean and versatile bar chart template.

    Features of the template


    • 100% customizable slides and easy to download.
    • Slides are available in different nodes & colors.
    • The slide contains 16:9 and 4:3 formats.
    • It is easy to change the colors of the slide quickly. 
    • Well-crafted template with an instant download facility.
    Advertisement

    You May Also Like These PowerPoint Templates

    Add to Wishlist
    Download
    AI Customize
    Quad chart with four colorful triangular sections labeled 01, 02, 03, and 04, each with placeholder text boxes on the sides.
    Add to Wishlist
    Download
    AI Customize
    Three-part pie chart infographic with colored segments, arrows pointing to text placeholders, and varied percentage values.
    Add to Wishlist
    Download
    AI Customize
    Spider web diagram with two datasets in contrasting colors, showing values for five dates with caption areas.
    Add to Wishlist
    Download
    AI Customize
    Practical Metric Chart PowerPoint Presentation Template
    Free
    Add to Wishlist
    Download
    AI Customize
    Waterfall slide showing multiple bars in varying colors with value labels and captions along the axis.
    Add to Wishlist
    Download
    AI Customize
    Combination of a horizontal bar chart and a vertical red bars on the right, with three percentage circles at the bottom.
    Free
    Add to Wishlist
    Download
    AI Customize
    Colorful 3D bar chart infographic with varying percentages with placeholder text.
    Add to Wishlist
    Download
    AI Customize
    Chart infographic with a world map marked with colored pins, a donut chart, and a bar graph with a caption area.
    Add to Wishlist
    Download
    AI Customize
    Slide with three bar charts, a pie chart, and arrow graphics in vibrant colors for data visualization.
    Free
    Add to Wishlist
    Download
    AI Customize
    Preventive maintenance PowerPoint slide with purple mountain peaks from maintenance to system, with icons below each.
    Add to Wishlist
    Download
    AI Customize
    Multicolored mekko chart displaying data for five topics, with percentages and totals in a blue column on the right.
    Add to Wishlist
    Download
    AI Customize
    Seven-segment radial chart in various colors, labeled 1 to 7, with editable text descriptions surrounding the chart.
    Add to Wishlist
    Download
    AI Customize
    Slide displaying a percentage model with four color coded sections representing various percentages with placeholder text.
    Add to Wishlist
    Download
    AI Customize
    Quad chart template with four colorful sections labeled from one to four, each with an icon, and corresponding text area.
    Add to Wishlist
    Download
    AI Customize
    Cockpit charts slide showing a donut chart with three data points and a global map with gender distribution.
    Add to Wishlist
    Download
    AI Customize
    Radial chart with four concentric arcs labeled 30%, 40%, 70%, and 100%, connected to icons and caption areas.
    Free
    Add to Wishlist
    Download
    AI Customize
    Orange and black cylindrical bars in a 3D chart design placed on a gray base with descriptive captions.
    Add to Wishlist
    Download
    AI Customize
    Slide illustrating a goal chart with an arrow pointing at a target and four colored bars showing percentage milestones.