Bangladesh PPT Presentation Templates And Google Slides Themes
Bangladesh PPT Presentation Template
Use this editable Bangladesh PPT presentation template to create an engaging presentation.
About the slide:
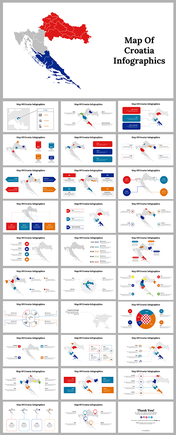
Our template features a map of Bangladesh with three flag-shaped arrows pointing to specific locations, each containing a number: 760,000 (green), 950,000 (red), and 1,000,000 (blue). To the right of the map, there are three captions aligned vertically.
Purpose of this slide:
To present statistical data related to different regions within Bangladesh in a visual and editable format. The numbers likely represent significant data points such as population figures, economic statistics, or other quantifiable metrics.
Who can use it?
Educators and students, business analysts and researchers, and government officials and NGOs.
Discover the Bangladesh PowerPoint presentation template today and start crafting presentations that both inspire and educate.
Features of the template:
- Slides are available in 4:3 & 16:9
- Well-crafted template with instant download.
- Get slides that are 100% customizable and easy to download
You May Also Like These PowerPoint Templates
Free


