Our Predesigned Annual Report Presentation Template

Annual report chart showing income percentages for four categories, with accompanying text for a quarter expansion.
P.ID : 4164
    26 slides
    Best Company Annual Report PPT And Google Slides Themes
    20 slides
    Creative Annual Report PowerPoint And Google Slides
    36 slides
    Best Business Report Infographics PowerPoint Presentation
    443 views
    24 Downloads
    Get Custom Slides by Experts
    Instantly Access Templates in PowerPoint

    Annual Report Presentation and Google Slides

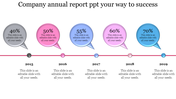
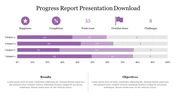
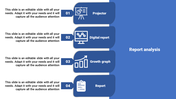
    The annual report presentation template offers a sleek and professional design, tailored for businesses seeking an engaging visual representation of their yearly performance. With a sophisticated graph design featuring four nodes, this template seamlessly combines creative analysis and a polished aesthetic. The use of professional shades and colors not only enhances the overall visual appeal but also ensures a cohesive and impactful presentation. Ideal for business professionals, this presentation template for annual reports serves as a versatile tool for conveying complex data and key achievements in a visually compelling manner, making it an indispensable asset for corporate presentations and strategic business communication.

    Feature of the template

    • 100% customizable slides and easy to download.
    • Slides available in different nodes & colors.
    • The slide is contained in 16:9 and 4:3 format.
    • Easy to change the slide colors quickly.
    • Well-crafted template with instant download facility. 
    Advertisement

    You May Also Like These PowerPoint Templates

    Add to Wishlist
    Download
    AI Customize
    The slide features a colorful donut chart, a table with captions and checkmarks, and a bar graph with a title text area.
    Add to Wishlist
    Download
    AI Customize
    Creative QBR Meaning PPT Presentation and Google Slides
    Add to Wishlist
    Download
    AI Customize
    Monthly business review slide showing project names, dates, budgets, and rates in a tabular format with a financial overview.
    Add to Wishlist
    Download
    AI Customize
    Colorful quarterly business review slide showcasing four steps with captions and icons.
    Add to Wishlist
    Download
    AI Customize
    Pack of slides featuring various layouts containing colorful bars indicating metrics on weekly report.
    Free
    Add to Wishlist
    Download
    AI Customize
    Pink gradient table with seven rows and four columns including financial data metrics for a monthly report.
    Add to Wishlist
    Download
    AI Customize
    Colorful quarterly report slide showing bar charts, a pie chart, and task timelines from 2021 to 2024 with three sections.
    Add to Wishlist
    Download
    AI Customize
    Monthly report slide with a grid layout, representing activities with relevant icons and placeholder text.
    Add to Wishlist
    Download
    AI Customize
    A grid style layout in teal theme, each containing icons and placeholders for statistics and descriptions.
    Add to Wishlist
    Download
    AI Customize
    Sales report template showcasing key performance metrics with bar and pie charts, set against blue-themed background.
    Add to Wishlist
    Download
    AI Customize
    Survey results slide featuring four circular percentage values in different colors with text boxes for placeholder text.
    Add to Wishlist
    Download
    AI Customize
    QBR slide with four icons with descriptions accompanied by a progress bar chart displaying the status for each task.
    Add to Wishlist
    Download
    AI Customize
    Weekly schedule with seven colorful circles for each day, followed by a to do and teal notes section at the bottom.
    Add to Wishlist
    Download
    AI Customize
    Social media reports slide, including color coded bar charts for followers, age demographics, and engagement statistics.
    Add to Wishlist
    Download
    AI Customize
    Slide featuring a colorful incident report with recorded details, and a description of the event with progress percentages.
    Add to Wishlist
    Download
    AI Customize
    Sales report slide featuring a sales summary table, bar graph comparing won and lost sales, and charts for revenue share.
    Add to Wishlist
    Download
    AI Customize
    Weekly report slide showing a grid with five weeks and seven days plus sections for goals and notes at the bottom.
    Free
    Add to Wishlist
    Download
    AI Customize
    Yearly Business Review Template and Google Slides