Graphical Annual Report PowerPoint Template Designs

PPT template for an annual report featuring a bar graph comparing data across three time periods with color coded categories.
P.ID : 9619
    1.1K+ views
    92 Downloads
    Get Custom Slides by Experts
    Instantly Access Templates in PowerPoint

    Annual Report PowerPoint Template


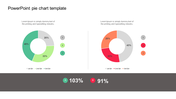
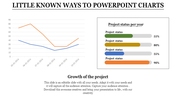
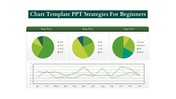
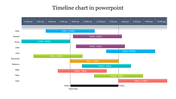
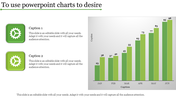
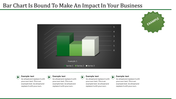
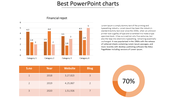
    Presenting our meticulously crafted Annual Report PowerPoint Template, designed to simplify presentation tasks and convey crucial details with clarity. At its core are dynamic bar charts in vibrant shades of purple, orange, and blue, enhancing visual appeal and facilitating easy comprehension. 


    Intelligently segmented terms across the bars enable presenters to highlight key metrics, trends, and milestones with remarkable clarity, making complex data digestible and accessible. Whether showcasing financial performance, strategic objectives, or market trends, our template offers a structured framework for effective communication. With its intuitive design, the Annual Report PowerPoint Template empowers presenters to deliver compelling presentations that resonate with stakeholders, investors, and decision-makers.


     Elevate your annual reporting process, inspire confidence, and leave a lasting impression with our versatile and intuitive template, designed for ease of use and maximum impact.


    Features of the template

    • 100% customizable slides and easy to download.
    • Slides are available in different nodes & colors.
    • The slide contains 16:9 and 4:3 formats.
    • It is easy to change the colors of the slide quickly. 
    • Well-crafted template with an instant download facility.
    Advertisement

    You May Also Like These PowerPoint Templates

    Free
    Add to Wishlist
    Download
    AI Customize
    Horizontal bar chart with green and gray bars of varying lengths, labeled with placeholder text, on a light background.
    Add to Wishlist
    Download
    AI Customize
    Four pencil-shaped bars for education in orange, blue, red, and green representing data from 2011 to 2014 with values.
    Free
    Add to Wishlist
    Download
    AI Customize
    Pie chart PPT slide with four sections in different colors and percentages, with accompanying text labels for each section.
    Add to Wishlist
    Download
    AI Customize
    Pie Chart PPT Presentation Template for Data Analysis
    Free
    Add to Wishlist
    Download
    AI Customize
    Bar chart with five purple cylinders and percentages arranged from left to right, next to a professional woman in a suit.
    Free
    Add to Wishlist
    Download
    AI Customize
    Bar chart with four vertical colored columns in green, blue, yellow, and red, with gray tops and captions above.
    Add to Wishlist
    Download
    AI Customize
    Bar chart in PowerPoint displaying data with titles and placeholders for example text and additional information.
    Add to Wishlist
    Download
    AI Customize
    Chart slide showing monthly bar graphs split into two sections and pie charts highlighting four color-coded items.
    Add to Wishlist
    Download
    AI Customize
    Four vertical 3D bars with percentages in red, pink, blue, and purple shades, aligned with captions.
    Add to Wishlist
    Download
    AI Customize
    Timeline chart slide displaying key dates and durations from July 2018 to October 2021 with placeholder text.
    Add to Wishlist
    Download
    AI Customize
    PowerPoint Chart Template And Google Slides-Three Node
    Free
    Add to Wishlist
    Download
    AI Customize
    Four cylindrical blue bars in a row next to a woman in a black suit in a simple design layout.
    Free
    Add to Wishlist
    Download
    AI Customize
    Green bar chart PowerPoint slide with percentages for the years 2017 through 2021 and a woman standing next to the chart.
    Add to Wishlist
    Download
    AI Customize
    Green circular chart with five segments labeled by categories and percentages, with descriptions around it.
    Add to Wishlist
    Download
    AI Customize
    3D bar chart infographic showing four blocks in blue, green, red, and orange with percentages and captions.
    Free
    Add to Wishlist
    Download
    AI Customize
    Illustrative slide combining a pie chart with 45% in green and five silhouette icons to convey data distribution.