Get This Animated Venn Diagram PowerPoint And Google Slides
Creative Animated Venn Diagram PowerPoint Template
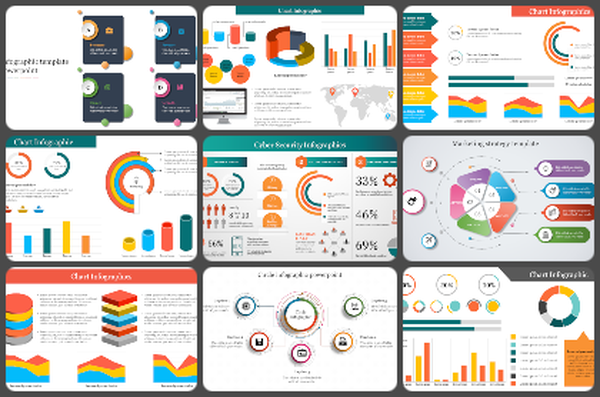
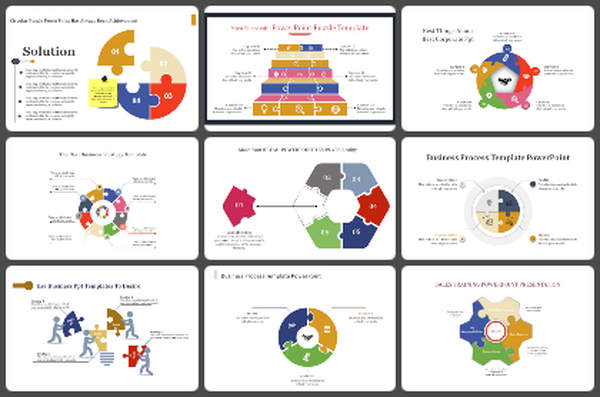
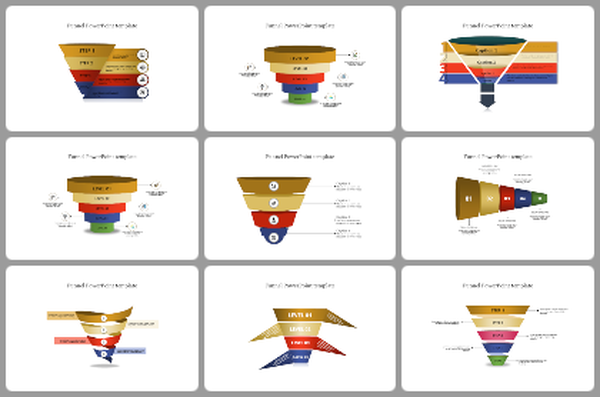
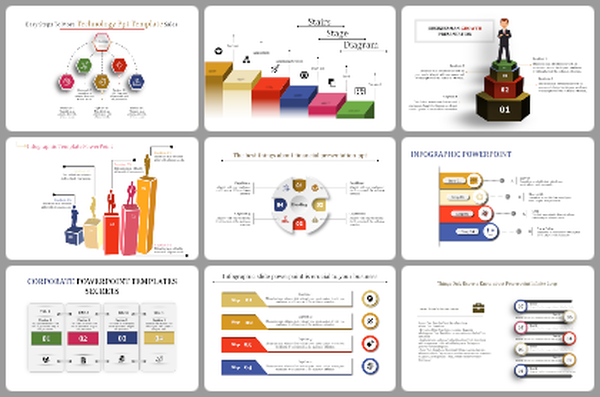
An animated Venn diagram is a dynamic visual representation used to illustrate the relationships and intersections between different sets or types of data. Unlike standard Venn diagrams, animated versions add motion and visual interest, improving audience engagement and understanding. By animating transitions between overlapping areas, users can emphasize specific comparisons or highlight changes over time, making complex concepts more accessible and memorable. Professionals in academia, business, research, and marketing can benefit from this template to create dynamic presentations or reports that visualize relationships between different datasets. Animated features improve audience attention and understanding, which is especially useful for presenting complex data or concepts in a clear and engaging manner. This slide deck offers fully editable templates with customizable animations, allowing users to adapt visual elements to their specific content and presentation style. Presenters can use the template's animated Venn diagrams to captivate their audience, emphasize key points, and make complex relationships or comparisons easier to understand. Encourage users to use this template to create impactful presentations that easily communicate complex data and concepts.
Features of this template
- 100% customizable slides and easy to download.
- The slide contains 16:9 and 4:3 formats.
- Easy to change the colors of the slide quickly.
- Highly compatible with PowerPoint and Google Slides.


