Analytics PowerPoint Template for PPT and Google Slide

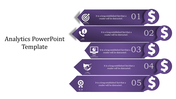


Analytics PowerPoint Template Presentation
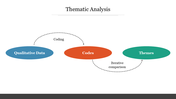
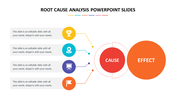
Unscrambling data got you down? Breathe easy! This editable Analytics PowerPoint template uses colorful hexagonal shapes to visually connect your ideas. Perfect for teachers, business folks, or anyone who wants to ditch confusing charts. This Template holds two text areas, making it simple to explain your data in a clear, engaging way. Stop wrestling with complicated charts – download this template and transform your data into a captivating story that everyone can grasp.
Features of the template
- 100% customizable slides and easy to download.
- The slides contain 16:9 and 4:3 formats.
- Easy to change the colors quickly.
- It is a well-crafted template with an instant download facility.
- It is a 100% pre-designed slide.
- The slide holds vibrant colors.


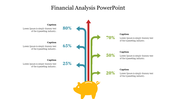
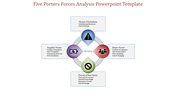
You May Also Like These PowerPoint Templates

Add to Wishlist
Download
AI Customize

Add to Wishlist
Download
AI Customize

Add to Wishlist
Download
AI Customize

Add to Wishlist
Download
AI Customize

Add to Wishlist
Download
AI Customize

Add to Wishlist
Download
AI Customize

Add to Wishlist
Download
AI Customize

Add to Wishlist
Download
AI Customize

Add to Wishlist
Download
AI Customize

Add to Wishlist
Download
AI Customize

Add to Wishlist
Download
AI Customize

Add to Wishlist
Download
AI Customize

Add to Wishlist
Download
AI Customize

Add to Wishlist
Download
AI Customize

Add to Wishlist
Download
AI Customize

Add to Wishlist
Download
AI Customize

Add to Wishlist
Download
AI Customize

Add to Wishlist
Download
AI Customize

Add to Wishlist
Download
AI Customize
