Free - Editable Analysis Presentation Template PPT and Google Slides
Free


Analysis Presentation Template
Seeking to communicate comprehensive analyses? Make use of our Analysis Presentation Template for your business needs. It is a powerful visual aid meticulously crafted for analysts, business strategists and marketing professionals seeking to communicate comprehensive analyses. The slide has a large circle at the core. It is given with a marketing strategy icon. This symbolizes the central focus. Surrounding the circle are six stages crucial for analysis.
Each of them is represented by relevant icons. They include targets, plans, strategies and teamwork. Ample space for captions beside each icon allows users to customize the content. Suitable for marketing teams, business analysts and project managers. The template streamlines the communication of data-driven insights and strategic analyses. Download now to enable the presentation of intricate analysis processes with clarity.
Features of the template
- The slide contains 16:9 and 4:3 formats.
- Compatible with Google slide themes and PowerPoint.
- 100% customizable slides and free to download.
- It is easy to change the colors of the slide quickly.
- Well-crafted template with an instant download facility.


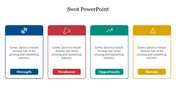
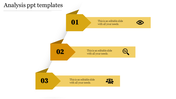
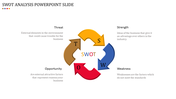
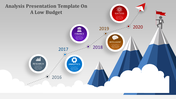
You May Also Like These PowerPoint Templates
Add to Wishlist
Download
AI Customize

Add to Wishlist
Download
AI Customize

Add to Wishlist
Download
AI Customize

Add to Wishlist
Download
AI Customize

Add to Wishlist
Download
AI Customize

Add to Wishlist
Download
AI Customize

Add to Wishlist
Download
AI Customize

Add to Wishlist
Download
AI Customize

Add to Wishlist
Download
AI Customize

Add to Wishlist
Download
AI Customize

Add to Wishlist
Download
AI Customize

Add to Wishlist
Download
AI Customize

Add to Wishlist
Download
AI Customize

Add to Wishlist
Download
AI Customize

Add to Wishlist
Download
AI Customize

Add to Wishlist
Download
AI Customize

Add to Wishlist
Download
AI Customize

Add to Wishlist
Download
AI Customize

Add to Wishlist
Download
AI Customize

Add to Wishlist
Download
AI Customize
