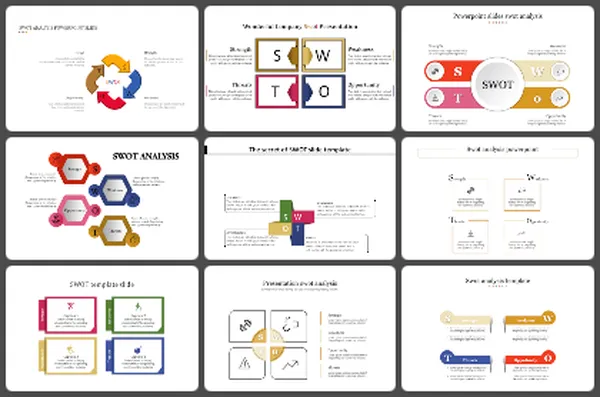
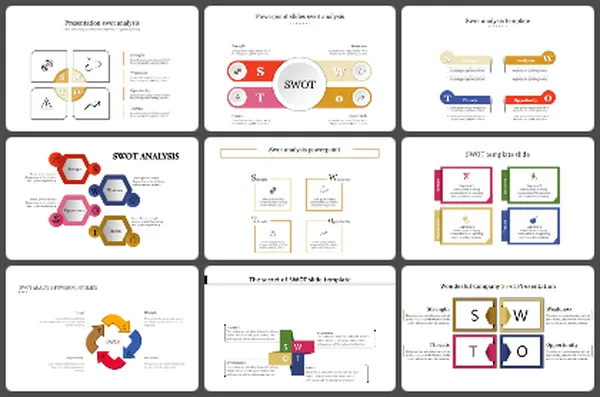
3 Noded Analysis PowerPoint Templates and Google Slides

 slide featuring three circular charts for data analysis, followed by a line chart displaying monthly trends.
P.ID : 6030
    1.7K+ views
    79 Downloads
    Get Custom Slides by Experts
    Instantly Access Templates in PowerPoint

    Creative Company Financial Charts Model Templates


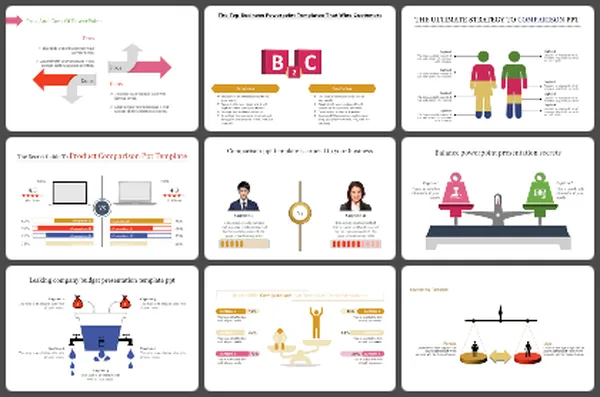
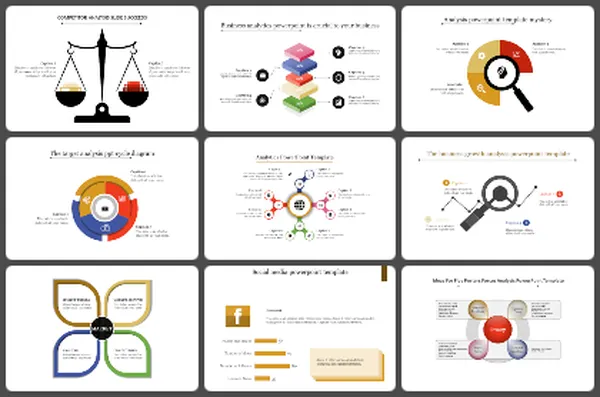
    The financial analysis of a company PPT template comes with the financial statements and the related financial analysis of a company. In addition, it contains a set of information and data in tables, figures, and other financial information to prepare an internal company report on the financial reports.


    Design of this template


    The More...

    Advertisement

    You May Also Like These PowerPoint Templates

    Add to Wishlist
    Download
    AI Customize
    Analytics PowerPoint slide with colorful bar charts, including icons for graphs, data analysis, and business targets.
    Add to Wishlist
    Download
    AI Customize
    Market analysis PowerPoint template featuring six percentage milestones from 30 to 90 with corresponding captions.
    Free
    Add to Wishlist
    Download
    AI Customize
    Business analytics PPT slide with a laptop, desktop, tablet, and phone in red, symbolizing various devices with captions.
    Add to Wishlist
    Download
    AI Customize
    Slide featuring green, pink, red, and orange circular graphics with icons and captions on a white background.
    Add to Wishlist
    Download
    AI Customize
    Easily Usable Performance PPT And Google Slides Template
    Add to Wishlist
    Download
    AI Customize
    A slide showing the colorful MOSCOW method for project priorities with each category labeled and described on a white theme.
    Add to Wishlist
    Download
    AI Customize
    A PPT slide showcasing a business analytics theme with icons for analysis, data, and insights, surrounded by six captions.
    Add to Wishlist
    Download
    AI Customize
    Dark themed slide featuring analytics elements, including a magnifying glass, mobile device, and percentages in bold.
    Add to Wishlist
    Download
    AI Customize
    Creative Business Analytics PowerPoint For Presentation
    Add to Wishlist
    Download
    AI Customize
    Red and black diagram with a magnifying glass focusing on three analysis sections with icons inside.
    Add to Wishlist
    Download
    AI Customize
    Business analysis slide showcasing steps with icons around a central illustration with a text description.
    Add to Wishlist
    Download
    AI Customize
    Slides featuring Venn diagrams and flowcharts in blue, purple, and orange, explaining diversity, equity, and inclusion.
    Add to Wishlist
    Download
    AI Customize
    Financial analysis slide with icons of coins, hand with cash, transaction, and refund on clipped sheets.
    Add to Wishlist
    Download
    AI Customize
    Six pie analysis charts in blue, red, orange, green, teal, and purple, displaying percentages from 15% to 90%.