80/20 Slide PowerPoint Templates and Google Slides

80 20 analysis slide illustrating the relationship between effort and results with percentage labels on a color coded circle.
P.ID : 60325
    652 views
    94 Downloads
    Get Custom Slides by Experts
    Instantly Access Templates in PowerPoint

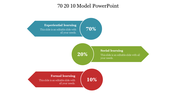
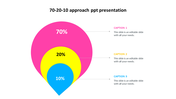
    80 20 Presentation Slide

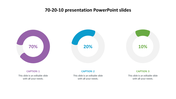
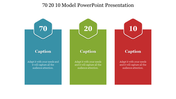
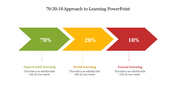
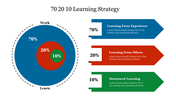
    The 80/20 principle is a powerful concept that states that 80% of the results come from 20% of the effort. This principle can be applied to all areas of life, from business to personal development. By focusing on the 20% that generates 80% of the results, you can optimize your time and resources for maximum effectiveness. Use our pre-made template to showcase the power of the 80/20 principle in your presentation. With its simple yet impactful design, this template is perfect for business, education, and personal development presentations.

    Features of the template

    • 100% customizable slides and easy to download.
    • Slides are available in different nodes & colors.
    • The slides contain 16:9 and 4:3 formats.
    • Easy to change the colors quickly.
    • It is a well-crafted template with an instant download facility.
    • Compatible with Google Slides and PowerPoint.
    • This slide is designed with a creative design with a text area.
    • It has an awesome design to represent the 80-20 concept. 
    Advertisement

    You May Also Like These PowerPoint Templates

    Add to Wishlist
    Download
    AI Customize
    100 Day Plan slide featuring three color coded sections for days 1 to 35, each with bullet points and placeholder text.
    Add to Wishlist
    Download
    AI Customize
    80 20 analysis slide illustrating the relationship between effort and results with percentage labels on a color coded circle.
    Free
    Add to Wishlist
    Download
    AI Customize
    Best 70-20-10 Approach To Learning PowerPoint Model
    Add to Wishlist
    Download
    AI Customize
    Slide pack featuring a 70-20-10 model, with flow diagrams, circular charts, and infographics in vibrant colors.
    Add to Wishlist
    Download
    AI Customize
    A slide displays a visual breakdown of the 70 20 10 development framework, with a pie chart highlighting its importance.
    Add to Wishlist
    Download
    AI Customize
    Infographic showing the 70 20 10 rule for learning, with experience, exposure, and education with colored circles.
    Add to Wishlist
    Download
    AI Customize
    Three steps learning approach slide illustrates experiential learning, social learning, and formal learning with text boxes.
    Free
    Add to Wishlist
    Download
    AI Customize
    Our Predesigned 70-20-10 Approach PPT Free Download
    Add to Wishlist
    Download
    AI Customize
    Three panel layout for the 70, 20, 10 rule with numbered circles in blue, red, and green atop text boxes.
    Add to Wishlist
    Download
    AI Customize
    Graphic illustrating the 70 20 10 learning and development approach with three colored sections with icons and text area.
    Free
    Add to Wishlist
    Download
    AI Customize
    Color coded circles in yellow, blue, and orange with numbers 70, 20, and 10 above corresponding learning categories.
    Add to Wishlist
    Download
    AI Customize
    Slide deck displaying the 70 20 10 development plan with three colorful shapes in orange, green, and red.
    Add to Wishlist
    Download
    AI Customize
    Slide deck with multiple 70 20 10 model layouts, illustrating career development with vibrant colors and diverse icons.
    Add to Wishlist
    Download
    AI Customize
    70 20 10 framework illustrated with increasing realized value from formal to experiential learning in a triangular shape.
    Add to Wishlist
    Download
    AI Customize
    Slide with three concentric circle diagrams in orange, blue, and purple, representing percentage splits, with captions below.