Free - Best PowerPoint Charts: Make the Most Out of Them
Free

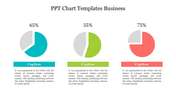
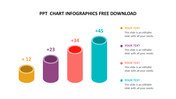
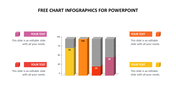
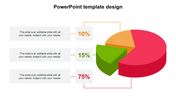
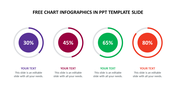
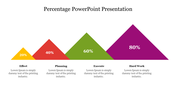
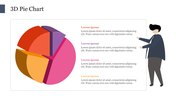
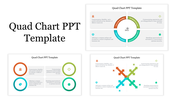
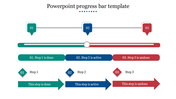
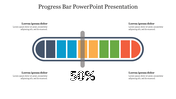

Chart Presentation Template
Enhance your PowerPoint presentations with our amazing collection of charts. We've carefully designed these charts to turn your data into captivating visuals that will impress your audience.
Our slide has many charts like bar graphs, line graphs, scatter plots, and pie charts. You can change them to fit your needs.The slide looks clean and modern, so your data will stand out and keep your audience interested.
Whether you're a business professional, a student, or a teacher, this slide is just what you need to make your presentations better and leave a lasting impression.
Make your presentations visually stunning. Look through our PowerPoint chart collection today and see the difference they can make. Get them now and use the power of data visualization to engage your audience and leave a lasting impression.
Features of the template:
- Easy to change the slide colors.
- 100 % customizable slides and easy to download.
- Well-crafted template with instant download.


You May Also Like These PowerPoint Templates
Add to Wishlist
Download
AI Customize

Add to Wishlist
Download
AI Customize

Add to Wishlist
Download
AI Customize


Add to Wishlist
Download
AI Customize

Add to Wishlist
Download
AI Customize

Add to Wishlist
Download
AI Customize

Add to Wishlist
Download
AI Customize

Add to Wishlist
Download
AI Customize

Add to Wishlist
Download
AI Customize

Add to Wishlist
Download
AI Customize

Add to Wishlist
Download
AI Customize

Add to Wishlist
Download
AI Customize

Add to Wishlist
Download
AI Customize

Add to Wishlist
Download
AI Customize

Add to Wishlist
Download
AI Customize

Add to Wishlist
Download
AI Customize


Add to Wishlist
Download
AI Customize

Free
Add to Wishlist
Download
AI Customize
