6 Way Venn Diagram Templates and Google Slides Themes

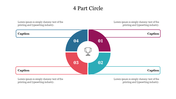


6 Circle Venn Diagram Presentation Slide
Connect the dots with the 6 Circle Venn Diagram - a powerful tool to illustrate complex relationships between six sets of data. This diagram is a great visual aid for presentations and lectures, providing a clear and concise overview of the topics being discussed. With our template, you can quickly create visually appealing diagrams allowing you to visualize complex data sets.
Features of the template
- 100% customizable slides and easy-to-download
- Slides are available in different nodes & colors.
- The slides contain 16:9 and 4:3 formats.
- It comes with six nodes.
- Easy to change the slide colors quickly.
- It is a well-crafted template with an instant download facility.
- We designed this slide with a circle design.
- You can use this in Microsoft PowerPoint.


You May Also Like These PowerPoint Templates
Add to Wishlist
Download
AI Customize


Add to Wishlist
Download
AI Customize

Add to Wishlist
Download
AI Customize


Add to Wishlist
Download
AI Customize

Add to Wishlist
Download
AI Customize


Add to Wishlist
Download
AI Customize

Add to Wishlist
Download
AI Customize

Add to Wishlist
Download
AI Customize

Add to Wishlist
Download
AI Customize

Add to Wishlist
Download
AI Customize

Add to Wishlist
Download
AI Customize

Add to Wishlist
Download
AI Customize

Add to Wishlist
Download
AI Customize

Add to Wishlist
Download
AI Customize

Add to Wishlist
Download
AI Customize


Add to Wishlist
Download
AI Customize
