Editable 3 Circle Venn Diagram Template Slide
Get Custom Slides by Experts
Enhance Your Presentations with Add-ins
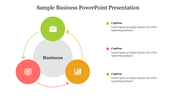
Circle Venn Diagram Presentation Slide
A 3 Circle Venn Diagram is a powerful visualization tool used to depict relationships and intersections between three different sets of data. This diagram consists of three circles that overlap each other, representing the shared traits and unique characteristics of each set. With its simple yet effective design, the 3 Circle Venn Diagram is a popular choice for organizing and analyzing complex data sets. It can be used in various fields such as education, business, and science to compare and contrast ideas, identify commonalities, and illustrate differences. This template is an excellent way to present information in a visually engaging manner and facilitate a deeper understanding of complex concepts.
Features of the template:
- 100% customizable slides and easy to download.
- It can be used in powerpoint and google slides
- The slide has 4:3 and 16:9 formats.
- Easy to change the slide colors quickly.
- Appealing presentation to impress an audience.
- Create feature-rich slide presentations.
- Crisp and elegant font style.
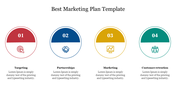
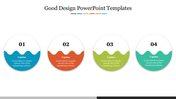
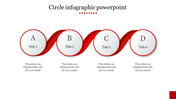
You May Also Like These PowerPoint Templates